
Genetic Ancestors – the Porcupine Chart
First let me define Genetic Ancestors. These are the ancestors who passed DNA down to you. Your DNA includes some DNA from each genetic ancestor. But, as we’ll see, not all of your ancestors contributed to your DNA. Some of your distant ancestors passed DNA down to their descendants, but that DNA never made it all the way to you. So let’s delve a little more into this concept, so you’ll know what to expect as you form Triangulated Groups, work with your Matches to find Common Ancestors, and fill out your chromosome map.
You get exactly 1/2 of your autosomal DNA (chromosomes 1-22) from each parent. Each parent has used the two chromosomes they got from their parents (your grandparents) to create one chromosome for you. Actually this is the fundamental way DNA is passed down to you and to each of your ancestors so let’s take a closer look at this process in Figure 1.
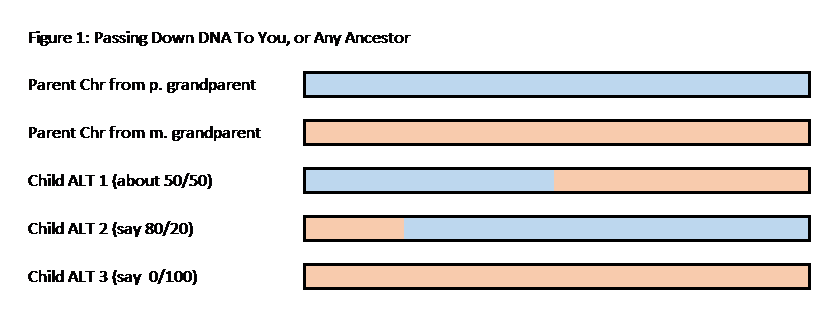
Here are some important points about Figure 1:
- The parent has two of each chromosome – one from each of his/her parents (the child’s grandparents)
- The parent takes part of each of the two chromosomes and makes a new chromosome (this process is called recombination)
- The parent then passes this new chromosome to a child
- Clearly, there is a wide range of alternative possibilities for the new chromosome – I’ve shown 3 alternatives: one where the new chromosome is roughly a 50/50 split between the grandparents; one with a larger split; and one where there is no split (no recombination), and the child gets all the DNA in this chromosome from one grandparent. All of these possibilities occur in nature. And in fact the odds are that one of your smaller chromosomes (18-22) is probably all from one grandparent.
- Note that the child got one chromosome from the parent who started with two chromosomes – the child got exactly 1/2 of the DNA from the parent.
- This figure shows the total amount of DNA in the new chromosome, not necessarily how it is split up into segments. For more on segments read: Segments: Bottom-up
- This figure is based on one chromosome for the child. The recombination process happens for all of the 22 chromosomes, for each of the two parents.
So, since you got exactly 1/2 of your atDNA from each parent, and they each got exactly 1/2 of their atDNA from their parent’s, wouldn’t you be getting exactly 1/4 of your DNA from each grandparent? Well… no! As shown in Figure 1, the child could get any mix of DNA from the grandparents – just as long as it added up to 100%. On individual chromosomes the mix can vary quite wildly, but in the aggregate over all 22 chromosomes, the average tends toward 50/50, but with a range of possibilities. However, in each case the two percentages will add up to 100%.
Also you can re-read: Measuring Segments to see that you can measure and total the two grandparents’ segments by base pairs (bp), centiMorgans (cM) or SNPs – you’ll get the same percentages and totals with any method.
So let’s continue this story by looking back one more generation – to the contribution by the great grandparents. Let’s continue to look at one chromosome and assume the mix from the grandparents is 45/55. To keep the description brief and the graphics clear, we’ll look at the 55% from the grandmother. Just like the standard process in Figure 1, this 55% portion will be composed of contributions from the two great grandparents. The great grandparent mix over this portion could range from 50/50 to 0/100, and the two numbers will always total 100. These two great grandparents cannot contribute to the 45% area (two other great grandparents do that), so their total contribution will only be of the 55% portion. So let’s say their mix is 60/40. So over this chromosome, these two great grandparents contributed 33% and 22% (for a 55% total). Note that the 60/40 split is wider than the 45/55 split. This actually happens in nature – the split’s tend to get wider [or wilder, or more random, or have more deviation more from the average] the farther back you go.
It’s time for another visual depiction – see Figure 2:
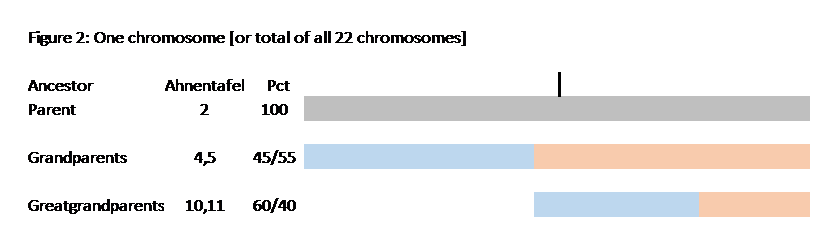
Important points from Figure 2:
- You see the total chromosome (100%) the child got from one parent. [The vertical black “tic” is at 50%]
- Under that is the 45/55 split between grandparents.
- The third row shows the 55% contribution of the parent’s grandmother, being split between her parents, by 60/40. Think of blue as the paternal side, and pink as the maternal side in each succeeding generation. I don’t show the other grandparents – it gets too messy. I just want to follow some ancestral path back, to show how the genetic (DNA) contribution of some ancestors gets smaller.
- Note that although this is shown for one chromosome, the same principle applies to the aggregate for all chromosomes.
- Note the use of Ahnentafel numbers to easily keep track of the ancestors.
So, let’s carry this story further back in Figure 3:

Important points in Figure 3:
- You see the diminishing amounts of DNA that are passed down by more distant ancestors.
- In the last two lines (4G and 5G grandparents) you see the percent of each couple still totals 100% (of that portion on this chromosome), but the farther back you go (down the chart) the split between the ancestral couple tends to get wider.
- In fact, for the 5G grandparents, one of them drops out altogether. That 5G grandparent that dropped out (#172) probably contributed to all of the other generations down to and including your parent, but when your parent recombined his parent’s DNA, it just didn’t include any of the small contributions from this particular 5G grandparent.
- On a chromosome level, this 5G grandparent (#172), may not have contributed to other chromosomes either. Once an ancestor drops out of all chromosomes, their contribution to you becomes 0, and this ancestor is then not a genetic ancestor!
- Re-read: Segments: Top-Down to see how the DNA of some ancestors drop out of the mix.
- Also note that this 5G grandparent (#172) probably did contribute some DNA to many of his other 5G grandchildren, just not to you.
As we look farther up the ancestral Tree, we find more and more ancestors drop out of the mix – you don’t have any DNA from them.
Another important point in this genetic ancestor analysis is that at each generation, going back, at least one ancestor in each couple has to be there to pass the DNA down. Another way to put this is that one parent in a generation may drop out of the DNA mix, but the other one cannot. One of the two of them had to pass down the DNA that the child (your ancestor) got and passed along, eventually reaching you. And that distant ancestor (who passed down the DNA) had to get that DNA from at least one of their parents. Theoretically, your DNA goes all the way back to DNA Adam and Eve. In a more practical timeframe, as in your genealogy, there will be genetic ancestors at each generation who contributed to your total DNA. This is true whether you have identified them in your ancestral Tree, or they are behind a brick wall – whether they are known to you, or not. At each and every generation, you will have genetic ancestors whose DNA contribution to you will add up to 100%. But not every ancestor will contribute – only the genetic ancestors will… This leads us to what I call the Porcupine Chart in Figure 4.
Figure 4: The Porcupine Chart:

Used by Permission
This wonderful chart was developed by The Coop Lab – see http://gcbias.org/2013/11/11/how-does-your-number-of-genetic-ancestors-grow-back-over-time/ for their article and another chart of genealogical and genetic ancestors vs generations. It shows a standard ancestral fan chart, colored in with only genetic ancestors, moving out from you at the center. Figure 4 is an approximation based on simulations. It is not “the” chart for everyone. Your results will vary, just as your random DNA, and the contribution by your ancestors, will vary. This chart is intended to illustrate several key points:
- Most of your closer ancestors contribute to your DNA.
- At some point a few ancestors drop out of the mix.
- When an ancestor drops out, his/her spouse/mate stays in the mix.
- Every ancestor who has contributed to your DNA has a porcupine “quill”.
- The “quills” extend forever – there is always another ancestor who passed down the DNA (theoretically back to DNA Adam and Eve, but in a practical sense, back farther than you can go on your genealogy).
- Although ancestors who contribute DNA to you continue to drop out with each succeeding generation going back, the number of contributing ancestors at each generation going back cannot get smaller. NB: some of the individuals may repeat as multiple ancestors, but the number of positions for ancestors in the Tree who contribute to your DNA never gets smaller. In the extreme, the number of genetic individuals gets very small at bottlenecks and deep ancestry; but the number of “slots” in the Tree is very great.
- In a practical sense – in your genealogy timeframe – there will be a growing number of ancestors who contributed to your DNA in each generation [each will have a different Ahnentafel number]; and some of them will be repeat ancestors [one individual ancestor may have multiple Ahnentafel numbers].
Above-threshold segments:
Generally, the closer genetic ancestors will contribute a lot to your DNA, and more distant genetic ancestors will pass down a smaller contribution to your DNA. But a genetic ancestor will always contribute something. We can divide our genetic ancestors into two groups: those who pass down “above-threshold” segments, and those who pass down smaller segments. When all the DNA from a genetic ancestor falls below the threshold value, you won’t see any cousins from this ancestor on your Match list. This is a limitation of our programs today. This is what has happens when a true 3rd cousin doesn’t show up as a Match. You and the 3rd cousin probably share some DNA from a common 2x great grandparent, but not enough to meet the matching criteria. However, if you compare yourself with this 3rd cousin at GEDmatch, and lower the threshold to 300 SNPs and 3cM, you will usually find matching IBD segments. Also, by testing and comparing siblings and other close relatives with this 3rd cousin, you may well find that they have above-threshold segments and match. The point is that some genetic ancestors may be above-threshold ancestors with you, and not others; and vice versa.
OK – we’ve now seen that you have many ancestors, but only some of them are genetic ancestors. And only some of your genetic ancestors will pass down above-threshold segments to you.
The most important group of ancestors to genetic genealogists is a subset of your genetic ancestors – it’s those genetic ancestors who passed down to you, and a Match, at least one DNA segment which is over the threshold amount.
So there is another chart which is based on ancestors who contributed DNA segments over the threshold amounts. The chart will be of a similar form to Figure 4, but the missing ancestors will occur closer to you, and the quills will be truncated when the segments get too small (the quills don’t go back forever). The chart will look like a skinnier porcupine with a crewcut – stop to visualize this…. These are the Common Ancestors we are looking for – this is the portion of our genealogy and our ancestry that we are working with. And, yes, some (many?) of these Common Ancestors will be beyond our known ancestral Trees. Someday… much of this chart will be drawn from our completed chromosome maps.
From my experience, it appears that the number of ancestors who contribute above-threshold DNA segments will usually include all of our 16 2G grandparents, maybe all of our 32 3G grandparents, and most of our 64 4G grandparents (5th cousin level). I think that most of our Matches are in the 6th to 8th cousin level (where some of our 7G grandparents have passed “sticky” segments down to us); and that it drops off after that, with some Matches out to 10-12th cousin level with a few of our more distant grandparents. That would be what the skinny porcupine with a crewcut would look like.
A final note: the ancestors we “see” through matching algorithms may be only part of the genetic ancestors who contribute above-threshold DNA to us. We can only compare with Matches who have taken an atDNA test. Some of our ancestors may have very few descendants, or be from an area or country where few folks take DNA tests. So the fact that we don’t find Matches to some ancestors, doesn’t necessarily mean they didn’t pass down sufficient DNA. I’ll have to explore this more, in a different blog post. Chromosome mapping will also help resolve this.
Summary Observations:
- Our genealogy ancestors fill up every slot in every generation of our ancestry Tree – doubling with each generation [each with a different Ahnentafel number] – forever.
- Individuals will repeat as ancestors [each may have multiple Ahnentafel numbers]
- Our genetic ancestors begin to drop out of our Tree at some point.
- Our genetic ancestors who have passed down above-threshold DNA segments begin to drop out of our Tree even sooner.
- At each and every generation, there are genetic ancestors whose DNA contributions total 100% – for all of our atDNA and for each chromosome.
- The number of genetic ancestors will increase with each generation. And like genealogy ancestors, individual genetic ancestors can also repeat.
- Each genetic ancestor will have an ancestral “quill” of genetic ancestors.
- Only genetic ancestors who pass down enough above-threshold DNA will be seen as Common Ancestors between Matches
- The number of above-threshold genetic ancestors will increase for perhaps 7-9 generations, and then decrease for the remaining generations.
- The above-threshold genetic ancestor chart will look like a skinny porcupine with a crew cut. The crew cut “quills” will include “sticky” segments which survive for several generations.
- A porcupine “quill” is not necessarily just one segment. The “quills” are for ancestors, and an ancestor may pass down multiple segments.
- At each generation, and on each chromosome, the DNA from a parent will be from some mix from his/her parents – ranging from an even 50/50 split to an all or nothing 0/100 split.
07A Segment-ology: Genetic Ancestors – the Porcupine Chart by Jim Bartlett 20150806

Pingback: Understanding and Using TGs | segment-ology
Thank you Jim for this article! Fascinating for sure. The Chart makes total sense and it helps to grasp the whole picture. Glad it mentioned that some lines may just not be visible yet, since no-one from them has been tested. Which I assume is the case with many people from other Countries. I guess I have to patient.
LikeLike
Denise, Thanks for the nice feedback. I actually think you can assign some TGs based on the fact that they have far fewer Matches (from the old country) compared to TGs from say Colonial Virginia.
LikeLike
Pingback: Friday Finds – 08/28/15
Jim – I really enjoy your posts. The bottom-up post is one of the best I’ve read this year and should be required reading : ). And I look forward to your pile-up post.
I’ve downloaded the new DNAgedcom tool and I’m surprised at how much DNA Ancestry throws out as noise. I have top 30 GEDmatches that aren’t in my top 2000 Ancestry matches, because Ancestry only used 25% of the segment (and these tend to occur in my pile-up areas). Conversely I have single-segment, 20cM matches that show as 4th cousins on Ancestry because they used the whole segment. I’m not saying Ancestry is wrong – in fact it makes sense. In any case I’ll be interested in your opinion.
LikeLike
Rich – there are good (Triangulated Groups) and bad (non-TGs) pileups. I don’t understand if or how AncestryDNA handles each. But it also appears to me that they often throw out good segments.
LikeLike
Yes, I get the one path idea. What I was thinking about is that for a short chr match, unsupported by enough segment matches on other chromosomes because they’ve dropped out already, that CA could be a long, long, way back. Since then its been traveling through such different family lines that no one has any idea at this point who the CA might be.
So effectively you really don’t know, and likely never will be able to figure out, who that person was and when he or she lived, especially if it was someone who lived in a non-English speaking country (think Ashkenazi). I’m not sure you can even find your closest real cousins beyond a generation or two based primarily a short chromosome match and at most only a couple of other short segment matches on longer chr.
If you know any tricks to get around that wall please, please include them in your endogamy blog.
LikeLike
June,I don’t think the short chromosomes "behave" differently. Once you eliminate all of the IBS segments, you are usually left with only one shared segment over 7cM. This is true of all chromosomes. Usually you only have one IBD segment to deal with. I don’t understand "unsupported by enough segment matches
LikeLike
yeah gedmatch’s mrca is wrong about generations. even with ‘mixed’ people
LikeLike
crossoverkaty – GEDmatch’s gen (aka MRCA) estimate should be considered as an average of a number of possibilities. Like the other companies, the range of this estimate gets wider the further back you go.
LikeLike
Jim,
I have noticed that I have a huge number of significant matches on chr 22 while often having perhaps only one or no segments above threshold with those same people elsewhere. I presume this is due to the fact that short chromosomes like 22 are often passed in in tact from one generation to the next. They are “sticky” and don’t drop out of the porcupine easily.
It looks to me like Gedmatch is giving the size of those segments too much credit and thus giving a much closer estimate of generations to MRCA than is even close to accurate. The same seems to be true with cousinship assignment in FTDNA. Do you know if anyone is doing any work on how short chromosomes affect prediction of generational differences?
LikeLike
June,
I agree with you that all 4 companies appear to estimate relatedness closer, on average, than it turns out to be. I think endogamy has a lot to do with it. A Match who shares an endogamous population with you will tend to have more shared segments, but the relationship due to the one shared segment is fixed, and stays the same. I don’t think the cousinship algorithms take endogamy into account.
I don’t agree that there is an issue with the smaller chromosomes (although I haven’t studied it much). The equalizer is the cM measurement. The cMs for each chromosome are based on empirical data, and basically should have the same weight in any autosome (chromosomes 1-22). The larger chromosomes are more likely to divide into 3 or 4 segments at each generation, while the smallest chromosomes are more likely to divide into 2 segments or remain intact at each generation. Sort of by definition, the average segment in one generation is 100cM or 1 Morgan. [stress average] The cM measurement should even out the effect of segments. I don’t see how this would tilt the cousinship estimates in any way.
Remember the cousinship estimates are just that – estimates. And the farther out they go, the wider the range of possibilities. And, in general, I too see estimates that are closer than the reality (and 3/4 of my ancestry is from Colonial Virginia).
LikeLike
So how do you explain large segment matches on 22 (over 20 cM) with only much smaller or no over threshold matches on other chromosomes?
LikeLike
June – look
LikeLike
I presume that means you think the other segments just dropped out. But here is the part of your earlier response that doesn’t make sense to me in that context alone:
A Match who shares an endogamous population with you will tend to have more shared segments, but the relationship due to the one shared segment is fixed, and stays the same. I don’t think the cousinship algorithms take endogamy into account.
Are you saying that endogamy reinforces matches on small chromosomes because they can be passed down by multiple people so that the segment you share with someone on that small chromosome could be coming down to each of you by entirely different paths? If not, how is endogamy coming into play?
LikeLike
I’m working on an endogamy blog post. I need some diagrams to explain it.
Jim – Sent from my iPhone – FaceTime!
>
LikeLike
Thanks, Jim.. I look forward to reading it as with all your very informative blogs.
LikeLike
I will say this about different paths: with endogamy, you have an ancestor who is in your Tree twice. One shared segment can come from him/her down only one path. There are two possible paths, the DNA comes down only one. Each segment is a unique event, down one path.
Jim – Sent from my iPhone – FaceTime!
>
LikeLike
And with or without endogamy, the path from a CA to you and your Match comes down different paths to you and your Match.
Jim – Sent from my iPhone – FaceTime!
>
LikeLike
I’m really struggling with summary observations 3 and 4. Did you mean to write “genealogy ancestor” and not “genetic ancestor” for those two statements? That change would make 3 make sense to me but not 4. Observation number 4 seems to contradict itself. Thanks.
LikeLike
I’ve re-read both 3 and 4 and confirm that I’m talking about genetic ancestors in both cases. I’m trying to show the difference between genealogy ancestors and genetic ancestors. Genealogy ancestors never drop out – your Tree is full of them at every generation. Your genetic ancestors do drop out – distant generations do not have genetic ancestors at every slot. A different way to say it is that all of your closer ancestors are also genetic ancestors; as you go back farther, some of your genealogy ancestors are no longer genetic ancestors – they drop off as genetic ancestors.
Jim – Sent from my iPhone – FaceTime!
>
LikeLike
Many thanks for the quick response! I believe I understand now but I’m finding the terminology / phrasing confusing. The definition in the post for “genetic ancestor” was in the first few sentences: “First let me define Genetic Ancestors. These are the ancestors who passed DNA down to you.” Then later: “As we look farther up the ancestral Tree, we find more and more ancestors drop out of the mix – you don’t have any DNA from them.” So a “dropped out ancestor” is one that did not pass any DNA to me, i.e. NOT a genetic ancestor.
LikeLike
pegannc
I see your point. I should say ancestors drop out as genetic ancestors; and some genetic ancestors drop out as above-threshold genetic ancestors. The point is the above-threshold genetic ancestors are a subset of all of our genetic ancestors, which genetic ancestors are a subset of all of our ancestors.
Jim – Sent from my iPhone – FaceTime!
>
LikeLike
And for 4: As we go back farther, some of the genetic ancestors will not have above-threshold DNA – they wouldn’t show up on the skinny-porcupine-with-a-crewcut chart- they “drop off” the chart – there is a blank space where that ancestor [Ahnentafel #] would have been (in the full fan chart).
Jim – Sent from my iPhone – FaceTime!
>
LikeLike
Okay, lets see if I understand. On each of the 22 Chromosomes, I can be represented from 0% to 100% by each of my parents. In turn, on each of those 22 will be some percent of my grandparents represented, the degree of which is dependent upon my parents split. So on #2, Mother is 70% and her parents split was 70% Dad, I would have 70% of 70% of Grand Dads DNA. Now on #3, can it go 55% Dad and 45% Mother and her split was 40% Dad, giving me 45% of 40% of Grand Dads DNA?
Or do I have it all wrong and I get 60% (say) of all 22 from Dear Old Dad, and 40% from Mommy Dearest?
Thanks,
Don
LikeLike
Don
Try again – you started on the wrong foot. Each of your parents gives you 100% of each chromosome – each of them gave you one complete chromosome. Each chromosome a parent gave you is made up parts from his/her parents, who are your grandparents. So each chromosome is part one grandparent and part the other grandparent. The split between these two grandparents is somewhere between 0/100 and 50/50.
LikeLike
Got it, thanks for your help. I may learn this yet, your humble student.
LikeLike
Hi Jim –
I loved this article on inheriting segments! The explanation of genetic ancestors was so helpful.
Just over the past two weeks, I’ve had a really interesting time comparing the results of Family Finder tests for my three sisters and me. It’s led to discovering new cousins, and even the beginning of the end of a brick wall.
I was perplexed as to why I was not matching my sisters and the newly discovered cousin, but after reading your article I realized I may just not have inherited that particular segment on the one chromosome my sisters had in common with the newly discovered cousin. As it turned out, though, I do have a match with them on that chromosome, but it is below the threshhold for a match in Family Finder. So – your article covered all of those situations that came up for us.
Kathy
LikeLike
Kathy,
Thanks. Besides being very random, our DNA is very complex. And the learning process is steep. It helps to understand what the real alternatives are. I’m glad this post helped you through some of the maze. The more you understand about atDNA, the more powerful the tool becomes.
LikeLike
Yes, omg, thank you. For the first time I think I now have a wee bit better comprehension of what you speak of.
LikeLiked by 1 person
Thanks,
I’m hoping each post will help a little more.
LikeLiked by 1 person