
Endogamy PART I – Shared DNA
This blogpost looks at the amount of shared DNA from endogamy. It does not address the genealogy of endogamy, but instead establishes some terminology and reference material.
First let’s define endogamy: the custom of marrying within the limits of a local community, clan or tribe [Oxford Dictionaries online].
This means cousins marry each other; and those two cousins have at least one ancestor who is the same. In others words an ancestor is in our tree more than once. The same individual occupies two (or more) blocks (or positions) in our tree, and their respective descendants (cousins) marry each other.
Classic examples of endogamous populations include Ashkenazi Jews and Low German Mennonites. In genealogy, endogamy is also used to describe multiple cousin marriages in limited population area such as those found in various areas of Colonial America, for instance [c.f. ISOGG wiki].
Let’s take a more in depth look at how DNA is passed down, how much DNA is shared between cousins, and examine the impact of endogamy. How does endogamy affect the total amount of DNA shared between cousins and the size of the shared segments?
Ground Rules
Use average cMs. DNA is very random and there is a wide range of possible values of segment cMs passed down from ancestors, as well as the amount of shared cMs between cousins. For this article, I will consistently use the calculated average values. In practice we see values above and below these average values, but with large data they should average out to the calculated values. By using the average cMs we should all come to the same results.
Use 7040cM as the total cMs in one person. Each company tracks the cMs a little differently. I picked this value because it’s roughly right*, it divides easily, and it compliments my notional Segment Size Chart here. We want to stay focused on the big picture and keep things in good perspective, rather than get into a debate about which company has the best total. I’ll use 7040 as the “base”, and also show the percentage that is passed down and shared. You can use a different base if you want. It’s the relative values we are after here, so it really doesn’t make much difference which base you use. The takeaway should be a general understanding of the effects of endogamy.
Use A to designate an ancestors who is in a pedigree more than once. A1 and A2 would be the same individual (A) in two different positions in a pedigree.
Use one Ancestor (A). We usually note a couple as the Common Ancestor because we don’t know which one passed the shared DNA segment down to you and your Match. But only one Ancestor of this couple had that DNA, and I use only one Ancestor is this analysis.
Base Chart [E1]
For this discussion we will use average values, and each descendant will get exactly half of their parent’s DNA. Also the shared amount decreases by a factor of 4 with each generation. This gives us the following Base Chart:
Explanation of Figure 1:
Values under You and Match are in cM. 4C means 4th Cousin; and 4C1R means 4th Cousin once removed. This will be similar in other figures.
Column 1 shows a Common Ancestor (A) at the top of the chart (with a total of 7040cM of DNA). The list of descendants is noted by Gen 1, Gen 2, etc. Note with atDNA, the descendants could be male or female.
Column 2 shows the total amount of DNA passed down from the Common Ancestor (A) to the descendants in each Gen. For the purposes of this article, I used one half of the ancestor’s DNA in each succeeding descendant. Usually this column represents you.
Column 3 shows the relationship between the descendants on your line vs. the descendants of a Match’s line in Column 4.
Column 4 shows the total amount of DNA passed down from the same Common Ancestor (A) to the descendants in each Gen. Again, I used one half of that ancestor’s DNA in each succeeding descendant. Usually this column represents your Match.
Column 5 shows the total amount of DNA that would be shared between you and your Match at each generation. Note that the amount decreases by a factor of 4 in each generation. [Sidenote:In the case of a half cousin, the amount of shared DNA is halved. Example 4C = 13.75cM shared; 4C1R = 6.875cM shared; 5C = 3.438cM shared.] Note that in Gen 6 (5C level) the share is 3.44cM, which is well below a matching threshold of 7cM. Clearly the average 5C would not show up as a Match. However, we know we have many 5C Matches above 7cM, so those Matches which are reported are well into the upper “tail” of the 5C distribution curve – see cM notional distribution curves here.
Column 6 shows these shared cMs as a percentage of the base [7040cM]
Column 7 is a little trick – it shows years inversely spaced at 30 year intervals, starting with a genealogist born about 1950. This allows you to either 1) look at a year of interest to you and see the probable cousins you’d have with ancestors of that time period, or 2) look at the cousinship of a Match and see approximately when the Common Ancestor lived. Of course it’s a very rough approximation, AND you should feel free to use different years that roughly work with your pedigree. This one works pretty well for me…
Column 8 is another little trick – it shows the number of ancestors you would have at each Gen going back – another inversion list. For example: if you and your Match are 8C, you would each have 512 ancestors at your Common Ancestor level. In other words the CA is 1 of 512 ancestors. It’s a handy lookup feature of Figure 1.
Endogamy factor – I have noted this chart as Endogamy 1 [E1], meaning both you and your Match only have the CA in your ancestry once. More on this later.
Modified Base Chart (Cousin Ancestors) [E2]
Now let’s modify the Base Chart and show you having two of the same Common Ancestor (A1 and A2) whose Great grandchildren married each other.
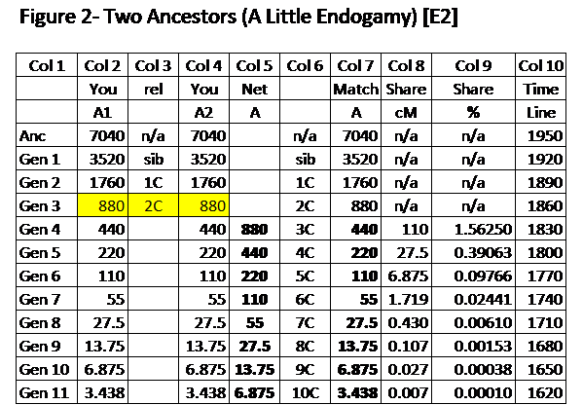
Explanation of Figure 2.
Columns 1-4 are similar those columns in Figure 1 with three important differences: (1) they are both on your side (2) the two 2C at Gen 3 marry each other, and (3) in Gen 4 the 440cM which was passed down from Gen 3 for each of A1 and A2 are shown, as well as that amount being combined into a total of 880cM for the single descendant (child) in Gen 4. In succeeding generations the DNA is halved at each generation.
Column 5 shows the net (combined) amount of DNA from A (A1 + A2) for the descendants of the Gen 3 marriage, starting in Gen 4. The net DNA is now twice as much as it was in Column 2 for Gen 4 in Figure 1.
Columns 6-7 are the same as Columns 3-4 in Figure 1.
Columns 8-9 have twice the values at each Gen compared to Figure 1. The shared DNA is now twice as much (by total and percentage).
Endogamy factor – With 2 identical Common Ancestors in your Tree, we have E2.
Important Note: When the DNA is passed from the Gen 3 parents (A1 and A2) to the Gen 4 child, the Gen 4 child gets the total DNA from A1 in various segments on one set of chromosomes (say the paternal side), and the DNA from A2 on the other set of chromosomes (the maternal side). There is no mix at this point. The various segments are subdivided, or not, and passed down normally. In the next generation, the Gen 4 child will recombine both chromosomes and pass the DNA to the Gen 5 child. There is a small probability that some segments from ancestors A1 and A2 may be exactly the same, but they would be on opposing chromosomes in Gen 4 and only one segment area could be passed on to Gen 5 child. There is a very small probability that separate, but adjacent, segments from A1 and A2 (on opposing chromosomes) could wind up adjacent again in Gen 5 child, and be “stitched together” to form a larger segment in Gen 5 from ancestor A than there was in Gen 4. Note that this very small probability can only happen in this one generation (the generation of a child with cousin parents passing DNA to his/her child; in this case Gen 4 to Gen5). In succeeding generations, all the segments for ancestor A are on one side, and can only be subdivided.
Key Findings
Total DNA – As it turns out, no matter where in your ancestry the cousins marry each other, their descendants will have twice the DNA from the Common Ancestor. It doesn’t matter if first cousins or fifth cousins marry, their descendants will carry twice the total Common Ancestor’s DNA (on average). And it doesn’t matter if cousins married recently or 6 generations back, their descendants will carry twice the Common Ancestor’s DNA. This simplifies the analysis a lot!
Shared DNA – the amount of shared DNA will double (with this E2 scenario). An E1 5C = 3.438cM (see Fig 1); an E2 5C = 6.875cM (see Fig 2)
Net effect – With E2 the shared DNA is equivalent to an additional “once removed” in the cousinship. A true 5C Match (normally sharing 3.438cM with E1), with E2 would look like a 4C1R (6.875cM)
Segment Sizes – Although, on average, the total DNA will be doubled, the various segments will not be larger, in general. For sure, the segment sizes are not doubled!
Modified Base Chart (3 Identical Common Ancestors) [E3]
Suppose you have three identical Common Ancestors (A1, A2 and A3) in your Tree. Usually this means two cousin marriages involving the same ancestor.

Explanation of Figure 3.
The columns are similar in function to that of Figure 2.
In Gen 3 two 2nd cousins, the highlighted descendants of A1 and A2, marry. Then in Gen 4, a child from this marriage, marries a descendant of A3, also highlighted.
Columns 2, 4 and 5 show the “half-amount” of DNA from ancestors A1, A2 and A3 that continues to add up in each generation (see Column 6). Note this is always the sum of respective portions from A1, A2 and A3, AND in Column 6 the net amount is halved in each succeeding generation.
Columns 9 and 10 show three times the total shared cM and total percent shared.
Endogamy factor – With 3 identical CAs in your Tree we have E3.
Modified Base Chart (2 Identical CAs plus 2 Identical CAs) [E4]
Let’s try an example with cousins in your Tree and cousins in your Match’s Tree. The process should be familiar now.
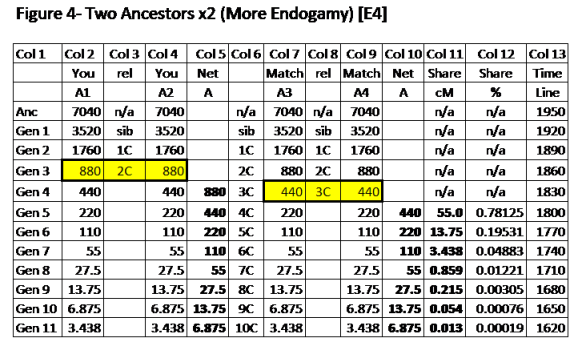
Explanation of Figure 4.
See previous Figures for explanations of the Columns.
As before, in Gen 3 two 2nd cousins in your Tree marry, and all succeeding total DNA is doubled.
In Gen 4 two 3rd cousins in your Match’s Tree marry, and all succeeding total DNA is doubled.
To get the shared DNA at Gen 5 we take the A1 DNA (220cM) compared to A3 DNA (220cM), and from Figure 1 we know this is 13.75cM, We then compare A1 to A4 and get 13.75cM; as is A2 to A3 and A2 to A4. So we have a total of 4 times 13.75cM or 55.0cM total shared. Here we have E2 on your side and E2 on your Match’s side.
Endogamy factor – E2 x E2 is E4.
Modified Base Chart (3 Identical CAs plus 2 Identical CAs) [E6]
So you might ask in the previous chart, do we add (E2 + E2 = E4) or multiply (E2 x E2 = E4)? Let’s resolve this in the following figure.

Explanation of Figure 5.
This is the reason why I continue to separately show the total contribution of DNA from each of the Ancestors (A1, A2, A3, A4, and A5 in this case). I don’t know how to compare 660cM and 440cM in Gen 5 to get the shared cM. But comparing these 5 ancestors in separate pairs means we can use shared values we already know from Figure 1. In this case, compare at 220cM for A1-A4, A1-A5, A2-A4, A2-A5, A3-A4 and A3-A5 – a total of 6 sharing comparisons. So we use E3 x E2 = E6.
Endogamy factor is E6; and we can multiply the 220cM-220cM share (13.75cM from Figure 1) by 6. Or 13.75cM x 6 = 82.5cM.
Common Ancestor is in only in each Tree once [E1]
What happens if we have lots of endogamy in our ancestry, but the Common Ancestor with a Match is not repeated in either Tree? Well we would not have any effects of endogamy. The Endogamy factor would be E1, and we’d use Figure 1. The multiplying effect of endogamy on shared DNA only comes into play when the Common Ancestor between you and a Match is repeated in your Tree or in your Match’s Tree.
Modified Base Chart (Common Ancestor is below Endogamy) [E1]
What happens if you and your Match have a Common Ancestor with lots of endogamy? In other words the Common Ancestor is the descendant of endogamy. The analysis of shared DNA is always done by starting with the Common Ancestor’s total DNA [7040cM, or 100%], and working down from there.
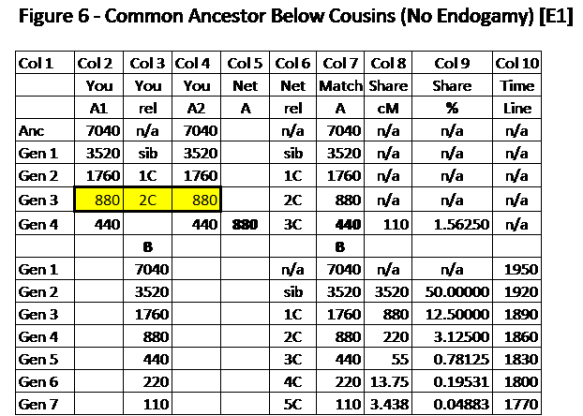
Explanation of Figure 6.
You can put as many identical Ancestors as you want in this chart (like A1 and A2 above, or the example in Figure 5). But to determine the shared DNA from a Common Ancestor, you must start with that ancestor – noted as B in Figure 6. In this example, ancestor B is only in your Tree once and your Match’s Tree once, notwithstanding the fact that B has multiple A ancestors. B is a separate, individual ancestor and the shared DNA from this B ancestor must be calculated with B as the base.
Endogamy factor is E1 in this case. There is no change in the amount or percentage of shared DNA with any cousin on Common Ancestor B in this case.
Summary Findings:
Total DNA in descendants of multiple Common Ancestors is multiplied by the number of CAs. It doesn’t matter how distant the marrying cousins are or where they are in your Tree. The number of Common Ancestors in a Tree determines the Endogamy factor – a CA in a Tree three times is E3, for example.
Shared DNA with a Cousin is multiplied by the Endogamy factors of you and your Match.
Endogamy only affects the shared DNA from the Common Ancestor between you and a Match.
- General endogamy, or “population endogamy”, does not affect the shared DNA calculation, except as it applies to the specific CA.
- Specific endogamy on Ancestors other than the Common Ancestor does not affect the shared DNA calculation.
- Endogamy ancestral to the Common Ancestor with a Match does not affect the shared DNA calculation
- If you know all 8 of your Great grandparents are different, and/or all 16 of your 2xGreat grandparents are all different, and/or can be sure (say by geography, ethnicity, etc.) that none of your 32 3xGreat grandparents are repeated as your ancestors, then your Endogamy factor would be E1 (use Figure 1) with any Match who is a cousin from one of these ancestors. If you are positive that any other more distant ancestor was in your Tree only once, the Endogamy factor is E1. However, you also need to consider the Endogamy factor of your Match.
Endogamy must be considered for both you and your Match.
- Use an Endogamy factor, E, for each time the Common Ancestor is in your Tree and/or your Match’s Tree.
- If the Common Ancestor is in a Tree only once the Endogamy factor is E1; twice E2; three times E3, etc.
- Multiply to combine Endogamy factors from you and your Match. Examples: E1 x E1 = E1 (no endogamy); E4 x E2 = E8, and the total amount of shared DNA in Figure 1 for that Gen is multiplied by 8. An E8 5C would share 8 x 3.438 = 27.5cM, which would look like a 3C1R.
Perceived effect of endogamy is the equivalent of one additional “once-removed” for each additional CA involved. So a true 4C (usually sharing 13.75cM), would share 27.5cM with E2 and look like a 3C1R, or 55cM with E4 and look like a 3C. Referring to Figure 1 at the 4C level, we have 32 ancestors, and so does our Match. So to reach E4, both you and the Match would need to have the 2xGreat grandparent (CA) in your Tree twice, for example.
If all or much of your ancestry is in one “pool” of endogamy, the opportunity for large Endogamy factors is great. If various branches of your ancestry come from very different geographic areas or ethnicities, etc., the Endogamy factors will be smaller. You might want to examine various parts of your ancestry to see where endogamy might play a role. Endogamy means more shared DNA, which will also mean more Matches.
The size of shared DNA segments is not, generally, changed by endogamy. Certainly, endogamy does not double the size of shared segments.
Summary Thoughts
This has been an interesting drill for me (I’m sorry for all the tables and numbers).
This article is based on the calculated averages – “your results may vary”. I am certain that many of our Matches are in the 6th to 8th cousin range, and our shared DNA is based on both endogamy and the long “tails” on the cM distribution curves.
I hope this blogpost will help facilitate further discussion of endogamy in genetic genealogy.
07D Segment-ology: Endogamy I – Shared DNA by Jim Bartlett 20151202
* At www.isogg.org/wiki/CentiMorgan the atDNA totals are 6769cM at FTDNA; 7174cM at GEDmatch and 7075cM at 23andMe; and ISOGG uses 6800cM at www.isogg.org/wiki/Autosomal_DNA_statistics. Other sources have different totals.

Fantastic post! I found it as I am researching the effect of endogamy when you have one 3 times great grandparent from an endogamous population (in my case European Jewish). It’s a very long story but has been unearthed with the wonders of DNA – a very consistent 9% EJ (now revised to 8% with the recent Ancestry update) on my otherwise Northwestern Europe/Ireland/Scotland results plus both daughters have 4% (most recent update). Extensive research had led to me to uncover a suspected non parental event at 2 times great grandparent level (my 3 times great uncle by marriage was half Ashkenazi and I believe he is my actual great great grandfather). The generational level all fits with the multiplicity of 100% EJ cousin matches both my myself and daughters have – quite a cluster round the lower end of my “close” cousin matches about 20 to 22 cmg across 2 segments is an rough average) and at the higher end of my distance cousin list (mid to high teens in cmg across mostly 2 DNA segments, sometimes only 1 and occasionally 3). About 3 quarters of my EJ matches relate back to one or other of these “close” cousins and in some cases all of them. I know as a result of all my research that none of these cousins can be any closer than having a shared 4th times great grandparent and in many cases probably it’s a 5th great grandparent so back into the mid 1700s and certainly no later than the 1770s. I am starting to build up a detailed picture of locations and quite plausible links between the English end of things and the German and Polish EJ links (the family were merchants). I know from my non Jewish DNA research that there is a wide range in results and shared DNA between cousin matches (I have an extensive knowledge of my family tree on many sides) but would I expect an EJ cousin match who say has 20 cmg across 2 segments to be ballpark a 4th cousin once removed or somewhere round sharing a 5th times great grandparent? Some idea of the effect of endogamy at the level I am talking about (one 100% Ashkenazi Jewish 3rd great grandfather) would considerably help me as I move forward with my research. Thanks for any insights you can offer and very best wishes!
LikeLike
Rosemaylily – it is very hard to estimate relationships with any kind of Jewish ancestry – it’s just so interwoven. The total DNA is skewed by the endogamy. My best advice is to take it a segment at a time and work on the Triangulated Groups around those segments. Jim
LikeLiked by 1 person
Thanks for your reply Jim. I think I’ll have to consider uploading my raw data results onto a specialist site like Gedcom as Ancestry don’t have a chromosome browser so I can’t isolate the matching segments.
LikeLike
I think uploading your raw DNA data to http://www.GEDmatch.com is a great idea. You’ll learn a lot more about how the DNA data can help you. Disclosure: I volunteer as a part time helper at GEDmatch.
Jim Bartlett – atDNA blog: http://www.segmentology.org
>
LikeLiked by 1 person
Hi there — this is a great site!
Just wanted to pass on some info regarding Ashekani Jews and the endogamy problem
1. A great overview is at https://medium.com/@CleverTitleTK/no-you-dont-really-have-7-900-4th-cousins-some-dna-basics-for-those-with-jewish-heritage-857f873399ff). Indeed, Ancestry.com told me I had 9000-something 4th (or closer) cousins (although now it simply lists it at 1000+).
2. Here’s a great family tree diagram which really illustrates (literally) the problem: https://2.bp.blogspot.com/-BJlRiLEAUPI/WaLASZgNxWI/AAAAAAAAMX4/jZin8_ORiOUx5DfDHtcyCYAbOqT294jegCLcBGAs/s1600/VizelEndogamy.jpg
3. Of possible interest, particularly to you, Jim, is Lara’s Jewealogy site, where she is crowdsourcing data from those with Ashkenazi ancestry, and analyzing the data, to come up with (if possible) averages, etc. See https://larasgenealogy.blogspot.com/2018/05/ashkenazic-shared-dna-survey-data-by.html . So, you can see, e.g., 3rd cousins in her survey, with an N of 285, have an average of 122.767 cM (as opposed to your theoretical 55 in your first chart), and with 4th cousins there is an even more dramatic different: N=162, the average cM is 60.39, while in your first chart it’s 13.75 cM. (Might that be due to the fact that, once in America and spread out, there was less endogamy among the Ashkenazi?)
In the meantime, I’m still trying to learn the great info that’s on your site — what a terrific resource. Thanks!
LikeLike
adcwonk, Thanks for the links and your kind feedback. I appreciate it. Jim
LikeLiked by 1 person
What would be really terrific is an Excel spreadsheet with the formulas so we can download and follow.
LikeLike
I don’t understand how to use this.
In Fig. 1, Col. 5, why does it show siblings sharing 3520 cM? Siblings average 2600 cM in common, not 3520. It also shows 1C at 880, 2C at 220 and 3C at 55, which are correct.
In Fig. 2, Col 9, why are the first 4 rows “n/a”?
In Fig. 2 Col 8, how do you arrive at 110 cM in Gen 4?
It would really help if you had family tree diagrams that corresponded to each scenario.
LikeLike
Pierre, This post was intended primarily to show, roughly, the impact of Endogamy. I do not recommend anyone to actually use these factors to try to estimate the actual cousinship. Blaine Bettinger’s chart at the ISOGG wiki shows what a wide distribution there is for cM vs cousinship. In my opinion, it’s a fools errand to try to calculate the generation to find the Common Ancestor – there is just too much variation. And the situation is even worse with Endogamy. I didn’t intend this to be a tool.
For the sibling share, we are both right. You are correct that what we see in most browsers in the 2600cM. But siblings do share about 50% of their atDNA, which would be 3520cM. The problem is that a chromosome browser lumps together the HIR and FIR and only calculates the overlap (about 2600cM). But about 920cM of the overlap is FIR – actually overlapping on both chromosomes at once. I used 3520cM so it would calculate the correct 50%.
The n/a is in Fig 2 because we should not be comparing at the ancestral level with two lines. What we are interest in is the effect after the cousins marry.
In Fig 2, Col 8, the 110cM in Gen 4 is twice the normal 55cM because the comparison is made to someone who has twice the atDNA that matches.
Again, the idea here is to get the concept across that Endogamy has an effect. This blog is for genealogists, and I actually went into more depth than I wanted to get the point across. But the intention is to understand the overall concept and effect, not to actually try to apply it.
LikeLike
What if you have a match from a very endogamous population that was founded originally by perhaps 50 couples with 50 different surnames. Anybody with surname X is descended from founder X. At the level of 16 great-great-grandparents no individual appears more than once in a match’s tree but there are only 10 surnames, and three people have the surname X. We don’t know “our” tree because the person is an adoptee, but wouldn’t there be a likelihood of an E factor greater than 1 because the people with surname X are likely to share more X DNA with each other? In other words, if you share 165 cM with this match, the relationship is likely to be more distant than 165 cM would indicate in a completely non-endogamous population?
LikeLike
PS my hypothetical situation above assumes that the person whose DNA we are talking about, is also a descendant of founder X.
LikeLike
Alexandra, As I noted below, the subject person is probably a descendant of most of the founders.
LikeLiked by 1 person
Alexandra, The Endogamy factor is always greater than 1. Someone with surname X could descend, on an all-male line, from Founder Ancestor X, but they would also have many other ancestors. With only 50 founder couples, almost everyone would descend from most, if not all, of the founders some way. With atDNA we are just as likely to share DNA with a Match from any one of our 64 4G grandparents. There is no greater probability of sharing a Common Ancestor with the same surname as with any of your other ancestors. The atDNA does not know any “names”, and is not partial to any line.
LikeLike
As Jim mentioned, more likely to be descendant of that founder. Today I was working on a woman’s tree as she told me (after I asked her) about where her family was from, as she said she was a descendant of The Bounty mutineers. She also told me what her mother’s surname was which to me it didn’t matter as usually these people descend from all 12 of the founding people of this particular population.
With those people, there were 6 men and 6 women, they all intermarried. Only one of the men and one of the women had 1 spouse each. Two of the women had 3 spouses, and two of the men had 3 spouses.
This woman who told me of her mother’s surname was not kidding as she descended from both parents through this surname multiple times and of the 12 founding people, she did not descend from one man and one woman.
LikeLike
I just came across an example I’m not sure how to figure out. I’ll try to diagram it as simply as possible while giving the essentials.
A1-B1—->C1 m. D1 —> E –female–> K
A2-B2—->C2 m. D2 —> F K m. L —–> father
A3-B3—> G m. H ——-> J m. F — male –> L father-mother –> cousin
M-N —————————————————————————-> mother
A-B—————————————————————————————————–>me
M-N—————————————————————————————————–>me
How many degrees of endogamy do we have here? My head is spinning!
Detia Roe
LikeLike
Detia – I cannot understand your diagram. Please draw it on paper, take a picture, and email it to me – Jim4bartletts@verizon.net
LikeLike
Judy, You are correct. You cannot share more than you got. And this post, was looking at the totals. In practice that total is usually broken down into segments, and the segments may not totally overlap. There is a lot of wiggle room, and we cannot rely on the number averages – it’s actually a pretty wide range. I’m just trying to illustrate some big-picture concepts here. Jim
LikeLike
This question may more correctly fit with your Endogamy PART II but here goes. It’s regarding matches.
My husband’s tree has the scenario you outline in Figure 2, except Gen 2 married each other. My husband’s brother married their first cousin (legal and not entirely uncommon in their country of origin). My husband, his brother and spouse are at Gen 2. My son, and his brother+cousin’s daughter are first cousins (Gen 2 on your chart). I’ll call them BoyCousin and GirlCousin. BoyCousin and GirlCousin share a set of great grandparents; GirlCousin got DNA doubly from them. This makes sense to me.
Here’s where I’m confused. Let’s say BoyCousin got 200 cM from the CA couple and GirlCousin got 400 cM. The match can’t be greater than the 200 cM that BoyCousin has, right? The maximum they can share is limited to what BoyCousin got. Am I missing something?
Thank you.
LikeLike
Pingback: More Fun Counting Frazer Relationships – Hartley DNA & Genealogy
Pingback: More On Frazer Endogamy – Hartley DNA & Genealogy
Great article! My know third cousin and I share almost 250cm and a longest block of 50cm. According to the standard charts this is enough for 2nd cousins, but we actually descend from the same great great grandfather! I’m a bit confused as to where the Endogamy would have taken place? Would our great great grandfather have been the off spring of a cousin marriage? I can’t get my head around the fact we share so much DNA when a 3rd cousin is around a 50-60cm share?
LikeLike
Seth – actually any increase due to endogamy would have to come from ancestors of your main Common Ancestor
LikeLike
Pingback: Endogamy PART II | segment-ology
Pingback: Friday Finds – 12/25/15
Thanks, Jim,
I’m descended from Mary Warren 4 times and her brother Joseph only once. She is my 9th g grandmother 3 times and my 10th g grandmother once.
Joel – http://www.jmhartley.com/HBlog/
LikeLike
Pingback: 3 Generations of Upshall DNA – Hartley DNA & Genealogy
Hi Jim,
I’m looking at my wife’s half great aunt Esther from Newfoundland. Her parents were related. According to gedmatch, Esther’s common (related) ancestor would be 4 generations away. In your Figure 2, you have the situation where someone has one extra common ancestor. It strikes me that this may be the more unusual case. I would think that a more common situation would be where someone has 2 extra common ancestors (e.g. 2 g-grandparents). I would think that the Figure 2, E2 situation would only occur when one ancestor remarried and had children from 2 different spouses. Then if the current day person had these half siblings on the maternal and paternal side, there would be an E2 situation.
Does this sound right?
LikeLike
Joel, E2 occurs when two descendants of one ancestor (or a couple) marry each other. Their children (and grandchildren, etc) will have the ancestor in their tree twice. In my tree (so far), I have 15 cases of E2, and my parents are 8th and 10th cousins.
Jim – http://www.segmentology.org
>
LikeLike
Thanks for setting me straight Jim. I keep looking at this from Bottom Up rather than Top Down to borrow a phrase from your earlier Blogs. My mother in law and her aunt should share 850 cM as half aunt/niece. They actually share 1090 cM by gedmatch and a little less by FTDNA. I believe that is due to the Aunt’s parents being related.
In my own genealogy, I descend from the Pilgrim Richard Warren 5 times. My 4g grandfather Samuel Bradford was descended from Richard 4 times and married Lucy Churchill who was only descended from Richard once! I suppose that would be an E5. As a result, I believe that I can triangulate matches with Richard Warren.
LikeLike
Joel
You can look up the average shared segment with a cousin from Richard WARREN and multiply that by 5 (maybe more, if you Match also descended multiple times. I suspect the average is still well below the threshold for a match, but you might be lucky…
One of the BARTLETT lines descends from Richard’s daughter, Mary (m Robert BARTLETT). There are about 20 with Family Finder. I’ll tell them to look for you as a Match.
Jim – http://www.segmentology.org
>
LikeLike
Pingback: Published by Segmentology: Endogamy I | GraveSeeker's Diary
I’m creating my own spreadsheet and started with figure 1. Why do the shared percentages of cMs decrease by a factor of 4? don’t they decrease by a factor of 2, i.e., 50%, 25%, 12.5%?
LikeLike
Bonnie, Each child gets 1/2 of their parents’ DNA. So one child has that parent’s DNA spread over a bunch of chromosomes. Now a second child also has 1/2 of that parent’s DNA but it also is spread randomly over the chromosomes. Since the first child has half of all the area covered, it’s likely that the second child will match on about half. Now go to the grandchildren level – the first grandchild has about 1/4 of the DNA covered. The second grandchild, with only 1/4 of the DNA will randomly cover 1/4 of the same DNA. The second grandchild will not randomly match half of the other grandchild’s DNA. The formula is 1/4 x 1/4 times 2. Now go down several generations to where a child gets 1/64 of an ancestor’s DNA – and say it’s spread over several chromosomes. Now take another descendant of that same ancestor who likewise got 1/64 of that ancestor’s DNA – spread over several chromosomes. It is unlikely that much of it will be on the same chromosomes, much less that the same locations. Still, it happens some: 1/64 x 1/64 x 2 = 1/2048 = 0.04883%
LikeLike
I see, I had to put it in a descendant chart, you are stating the shared % of the Common Ancestor’s DNA for cousins. The 50% (divided by 2) calculation of shared cMs is for aunts, uncles, nieces, nephews, grandparents, etc.
LikeLike
Yes. It’s important to keep the two things separated 1) how much the descendant gets from the ancestor (1/2 less in each generation) and 2) how much is shared with a cousin, which decreases much faster than the 1/2 factor.
Jim – http://www.segmentology.org
>
LikeLike
I was confused by the statement that said the column shows the shared cMs as a percentage of the base
LikeLike
The base is the amount the Common Ancestor started with.
Jim – http://www.segmentology.org
>
LikeLike
Great article Jim. This also perhaps provides a way to determine if endogamy exists within a family if you share more than expected with a cousin at a known relationship level.
LikeLike
Roberta, thanks for the feedback and insights. At some point we’ll have a set of curves for various possibilities. It will be a good tool. But DNA randomness will always trump the curves.
Jim – http://www.segmentology.org
>
LikeLike
Hi,
I want to let you know that your blog is listed in today’s Fab Finds post at http://janasgenealogyandfamilyhistory.blogspot.com/2015/12/follow-friday-fab-finds-for-december-4.html
Have a great weekend!
LikeLike
Thanks, Jana
LikeLike
I think I get it. I think my question was answered in Figure 4. I assume that A1-A4 are the same person.
The other comment I have is that I was initially confused and was reading your charts upside down. This was because there was a ‘you’ at the top of one of the columns and you use inverse dates in one of the columns. However, your example in Figure 3 forced me to see your Charts in the right light.
LikeLike
Joel – glad it worked out for you. The two “inverse” tricks are handy tools I use every day. Perhaps I should say Your line (vs You) and Match’s line.
Jim – http://www.segmentology.org
>
LikeLike
Thanks JIm, This is a classic on par with your articles on Segments.
I’m up to Figure 2 and have a question. Does the Match in that figure match the ancestor twice or once? I can see where it could happen either way, and does it make a difference? In other words, does it matter if the people you are comparing yourself with are descended from the same cousin marriage or not?
LikeLike
Joel,
The Match doesn’t match the Ancestor, the Match descends from the Ancestor – descends from the Common Ancestor A. You also descend from the CA A. At this point you don’t know, and can’t tell which path from A you got your shared segment from. The shared segment is the same DNA that you and your Match have. The shared segment which created the match between the two of you. This shared segment is part (maybe all) of the total shared DNA between you and the Match. On average, you got twice as much DNA from CA A, and you’ll share twice as much with the Match.
A is one person, and you both descend from A.
Read on to see examples of the Match also having Ancestor A in his/her Tree multiple times.
Jim – http://www.segmentology.org
>
LikeLike
Another great post, Jim. I managed to work out the very first step myself some time ago, but I’m really glad you went the extra mile and did the rest for us.
Unfortunately, all we usually have, at best, is length of shared largest segment, the total shared and two family trees that don’t go back far enough. The match tells us we should be 3rd or 4th or 5th cousins, but the trees tell us that the link must be further back.
We don’t know whether the closer match prediction is due to the spread shown in the graph you drew a post or two ago, or whether there is endogamy present somewhere beyond our trees.
Some of your replies have matches that can be helped by this post. Most people do not.
And there is one issue that I have never seen addressed adequately – the effect of cutoffs.
On that graph of yours the smaller end of each curve is curtailed by up to three cutoff factors – minimum length of segment, minimum largest segment length and minimum total match cM.
We don’t see the smaller ones. So the ones we do see from the more distant cousins tend to come from the middle to upper part of each bell curve. And because the smaller ones without distant endogamy are less likely to show up at all, we also tend to see more with some endogamy.
LikeLike
My 2nd Great Grandparents were first cousins, so their child (my Great Grandmother) would have 7040 cM; her son, my grandfather would have 3520 cM, his daughter, my mother, would have 1760 cM, and I would have 880 cM passed on to me. My second cousin from my grandfather’s brother would also have 880 cM. Am I understanding your approach correctly?
LikeLike
Sandy – yes! And they share (overlap each other) 220cM – which is probably several segments over several chromosomes.
LikeLike
Correction, 16 2x great-grandparents.
LikeLike
Wow, very complex! I understand what you are getting at with these formulas.
I had my friend print out his genealogy for me since he got his father DNA tested and I got my mother DNA tested and for both of them we know that all 16 of their great-grandparents are not related. Carefully looking at some of these 16 great-grandparents (for each my mother and my friend’s father) even their place of origin isn’t exactly the same. They are obviously of the same ethnicity.
But this is what they share at FTDNA, 23andme, GEDmatch.com and dna.land.
FTDNA = 339.66cM total; 23.57cM longest block
23andme = 203.cM total; 27.2cM largest segment
GEDmatch = 120.6cM total; 31.0cM largest segment
DNA.land = 443.86cM total shared (215.32cM total RECENT shared); 30.16cM longest recent shared segment
There are other matches to both my mother and my friend’s father that share much more than our parents do with each other, yet these other people definitely are not from the same geographic area. In fact, they are from more than 4,000+ miles away and their ancestors have been in their geographic area for at least since 1200AD, same with our ancestors in their own geographic location.
Meanwhile, I finally got a Pitcairn resident to agree to upgrade her kit to an autosomal test since there are other people who match my mother and me who have ties to Norfolk island, the island that was resettled in 1859 by Pitcairn people. The Pitcairn people descend from Fletcher Christian and his mutineers. Although there were 27 of them that arrived on the island in 1790, only 6 of those mutineers and 6 Tahitian women were able to produce offspring.
LikeLike
Kalani, It looks like a lot of shared DNA, but not consistent. Good luck,
LikeLike
Yes, not consistent because of the different companies. What is consistent is that a lot of these endogamous matches are super high. Above 100cM.
LikeLike
This is indeed very strange.
Jim – http://www.segmentology.org
>
LikeLike
I don’t understand what is strange about it. I come from an endogamous population.
LikeLike
Is it the totals that are strange? At GEDmatch, the highest shared after relatives is 510cM. We don’t know of any known connection. The largest segment for that 510cM is 26.9cM. That alone should indicate how endogamous this is. That total is followed by the following total shared: 428.5cM, 474.3cM, 388.2cM, 331.9cM, , 350.2cM, 331.7cM, 282.1cM, 305.8cM, 283cM, 304.7cM, 276.8cM, 312.4cM, , 264.7cM, 241.7cM, 246.2cM, , 274.1cM, 255.5cM, 258.9cM, 247cM, 273.8cM, 267.4cM, 270.6cM, 240.7cM, 252.5cM, 252.3cM, 219.4cM, 229.6cM, 220.4cM, 221cM, 233.6cM, 212.8cM, 185.4cM (known 1/2 3rd cousin), 184.1cM, 183.7cM, 191.2cM, 192.7cM, 195.6cM, 194.3cM, 191.1cM, 195.6cM, 205.7cM, 187.5cM, 206.9cM, 187.4cM, 172.1cM, 176.1cM, 165.4cM, 164.6cM, 162.8cM, 164.6cM, 159.5cM, 172.8cM, 180.6cM, 169.8cM, 178cM, 162.3cM, 140.8cM, (this is actually a known 3rd cousin), 149.5cM, 139.2cM, 139.8cM, 144.5cM, 152.4cM, 145.8cM, 140.4cM, 142.5cM, 146.6cM, 121.4cM, 123.6cM, 132.9cM, 1238.7cM, 123.3cM, 117.1cM, 118.2cM, 119.6cM, 115.8cM, 112.5cM, 119.8cM, 112.9cM, 116.4cM, 118.9cM, 115.7cM, 110.7cM, 111.1cM, and 136cM.
Of course this doesn’t count all those who tested at 23andme that did not transfer, same with FTDNA, and also at Ancestry. In fact our two closest matches are at Ancestry & refused to transfer over to GEDmatch, but I know how I connect to both.
LikeLike
Interesting analysis, Jim, but my head is spinning a bit in trying to figure out how to make use of it. If you’re planning to do that in a future post just tell me to hold my horses. But if not could you possibly help me try to figure out how someone that FTDNA identifies as a strong second cousin (249.33 cM shared, 42.44 max segment) ties to me at what generation? Your tables look like a good approximation for me as I was born in 1947.
He is about 1/2 generation older than I and we can not identify the name of a common ancestor. Neither of us knows anything about the siblings of our ancestors. His grandmother was born about the same time as my grandfather who share the same surname (Okun), but the given names of our great grandparents are different. Offhand this makes it looks like we might share a great great grandparent who is unknown to either of us but I’m wondering how generational removal might come into play here.
LikeLike
June, Shared DNA of 249cM is pretty close to a nominal 2nd cousin. A 2nd cousin would mean you both descend from the same Great grandparent (of which you have 8). From the geography of your 4 grandparents, you might be able to rule out some of the 8 Great grandparents, and narrow down your focus. Since you have the same surname in both Trees, that seems like a pretty strong clue to me. Another generation back would give you nominal 55cM shared. You’d need E4 to raise that to 220cM to get you in the ball park. For that each of you would need to have a 2G grandparent in your Trees twice and be the Common Ancestor.
Good luck – please post back if you figure it out.
LikeLike
Thanks, Jim. Unfortunately we only have the given names of 3 great grandparents and maybe one maiden surname. Two for me and one for him and we’ve hit a brick wall searching on those names, at least online. Geography isn’t on our side either. He was born in Moscow and believes that both his grandmother and great grandfather were as well while my grandfather’s family seems to hail most recently from southeastern Belarus. Personally I have my doubts about his side given that Moscow was beyond the Pale. His grandmother married a career Russian military man and I suspect that is when his branch moved to Moscow.
What I’ve been hoping to do with DNA is find someone who I can definitely match to the Okun side of my family that has a tree going far enough back that we can find the connection. I also have one known male Okun cousin who could be Y tested as well as this second cousin, but I’m not really sure how much that might help since it focuses on more distant relationships. Any other suggestions would be most welcome.
I will definitely let you know about any success I have.
LikeLike
Looks like I need to spend some time with this blog entry.
I do have a question about a similar situation. What would you call it where one male fathers hundreds and hundreds of children with scores and scores of (enslaved) women?
Thanks for any information.
Jack Wyatt
LikeLike
Jack, I’ll not try to put a name on it. But it doesn’t, by itself, create endogamy. If some of his descendants marry each other, and two people had him as a Common Ancestor, then endogamy kicks in. In each situation, it pays to draw the picture! Or you can recreate my spreadsheets and fill in the Match and Common Ancestor and work the math. Again, unless cousins marry, you won’t have endogamy.
LikeLike