
This is another blog post that gives you some idea of what to expect with autosomal DNA and your segments. In this post we’ll look at the formation of a TG (Triangulated Group). We’ll walk through the steps:
- Start with overlapping segment data
- Simplify the data by rounding
- Sort by Chromosome and Start location
- Then Triangulate the segments (no genealogy required)
- Highlight one of the two resulting TGs
- Show this data graphically – like you’d see in a chromosome browser
- Overlay the total TG
- Then use our imagination and x-ray vision (or GEDmatch) to show what the ancestral segments of the Matches might look like
- Do some analysis…
Ready?
Figure 1. Some overlapping segment data

Letters represent Match names – data is taken from my spreadsheet.
Figure 2 – divide the Start/End locations by 1000000

It’s much easier to read the Start/End locations in Mbp; and it’s just as accurate for genealogy.
Figure 3 – the data is sorted by Chromosome and Start location

This makes it much easier to see overlapping segments.
Figure 4 – this shows the results of Triangulation into groups 16A and 16B.

No genealogy was involved in this process – it’s purely a matter of comparing segments at 23andMe or GEDmatch; or looking for ICW Matches in this list and each ICW list at FTDNA. Again, this is real data from my spreadsheet. Often there is more mixture between the two TGs, but I hope you get the idea.
Figure 5 – Here is only TG 16B data

It’s still arranged by Chromosome and Start location.
Figure 6 – Same data and the shared segments displayed graphically

This is how you’d see the data in a chromosome browser. Note the top 11 bars will all match each other. The bottom bars will usually all match each other too, and they’ll usually also match the top 8 bars, but maybe R and N will not match at the 7cM level at GEDmatch. Just lower the level to 500 SNPs and 5cM and you’ll find there is enough for a Match. Let’s see what the TG for this data looks like…
Figure 7 – Now the fun begins…
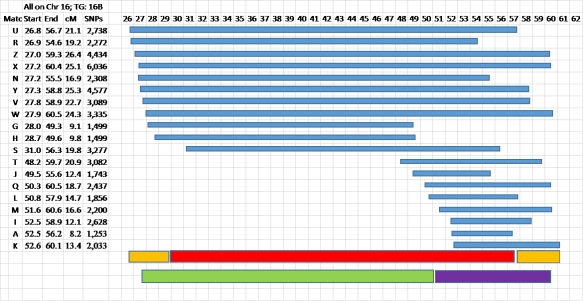
Usually the TG is pretty clear cut, but I’ve intentionally selected one with two kinds of ambiguity. In almost all cases the ends of the segments are fuzzy. You can read about Fuzzy Data in my blog post here.
Judgment is needed at this point. I’ve shown the “guaranteed” TG in red, with orange tips where the data looks fuzzy. I want to emphasize that this is NOT a problem for genealogy – the TG (wherever the true crossover points are that define the TG Start and End locations – somewhere in the orange areas) represents an ancestral segment from one of your ancestors. The fuzzy ends are not an issue. Your Matches will share a Common Ancestor with you – and that’s where the focus should be. The crossovers defining the real TG will be somewhere in the fuzzy orange tips.
You can also see that this data indicates a probable more distant crossover point – around say 51Mbp. In this case the top 8 Matches and Match S are probably closer cousins sharing a larger, closer segment with you. At this point you might want to review Crossovers by Generation here. Going back one or more generations we may see the large red TG being subdivided into two smaller ancestral segments – each with its own Common Ancestor each one of which is ancestral to the Common Ancestor for the red segment. In this case the last 8 Matches (T, J, Q, L, M, I, A and K) will have a different, more distant CA than Matches G and H. The main, red, TG may be from a 5G grandparent, and the smaller, green and purple segments may be from a 6G or 7G grandparent. Actually the purple segment, as an example, may pass intact through several generations, and you could share this same segment with 7C and 8C…
Again, most of your TGs will be tighter and from a single CA, but I wanted to take this opportunity to show what sometimes happens. You can avoid any conflict by watching for this situation and just declaring two TGs in this case – see the green and purple bars. Then it’s like the case where a close cousin spans more than one TG – the close cousin will help you define a larger segment from a closer ancestor, and the close cousin, along with different groups of Matches in different TGs will share more distant Common Ancestors with those TGs, but those more distant CAs will be ancestral to the MRCA the close cousin shares with you.
So now let’s use our imagination a little (or we could actually Triangulate this area from the perspective of some of our Matches. In this next Figure 8, I’ve guessed at what the ancestral segments might be the Common Ancestor down to the different Matches – as shown in green.
Figure 8 – showing ancestral segments for all Matches

In some cases our Matches have somewhat larger ancestral segments than we have, or they might have segments that extend over one end of our ancestral segment, or the other. In all cases the blue represents the overlap between each Match’s ancestral segment and our own ancestral segment. And the data is not exact, so the ends often don’t line up vertically. The long green bar at the bottom of Figure 8 is a segment an ancestor passed down to living people – you got part of it, the red part.
At GEDmatch it’s often fun, and instructive, to compare two Matches to each other. Sometimes they turn out to be parent/child, or siblings. This is the exercise you’ll want to do if you are trying to map an ancestor.
So, again, if you have collected a lot of shared segments from FTDNA, 23andMe and GEDmatch, they have to go somewhere. It’s not hard to compare them to each other and see where they Triangulate. If they are IBD, they have to go on one chromosome or the other. When you do this you’ll find there are natural break points where the crossover points are located (often the precise location is a little fuzzy). Just look at the data above.
05E Segment-ology: Anatomy of a TG by Jim Bartlett 20160204

Pingback: The Life of a DNA Segment | segment-ology
Great blog I ennjoyed reading
LikeLike
Ivy, Thanks for your feedback;>j Jim
LikeLike
In Figure 4, how do you know what is in TG A vs. B
LikeLike
1792armory, It’s arbitrary, and doesn’t matter, because eventually you will change TG A and TG B to some other name to reflect where it is and which side it’s on. So when you start, just pick a good sized segment and call that TG A. Then all the segments that Triangulate with it, also go into TG A. When another good sized segment doesn’t Triangulate into TG A, call it TG B, and add in any segment that Triangulate there. Then the next segment would start TG C, etc. I would rename the TGs such that the first one on Chromosome 6 was 06A, then when you use genealogy and determine which side it’s on, you can call it 06AM or 06AP (Maternal or Paternal). By using such a naming pattern you can give every TG a unique name. I estimate there are about 400 TGs, based on my experience.
LikeLike
Pingback: Your TGs are pretty unique! | segment-ology
Above you said that you painstakingly created each bar in figures 6 and 7 by hand. I have found a description of a method to automatically have Excel create these bars from the data in the tables. The URL is at https://peltiertech.com/floating-bars-excel-charts/, and the section that applies is called “Floating Bars” under “Stacked Bar Charts (Horizontal Bars).” By creating a stacked bar, then making the first half of the bar invisible, the lengths and positions of each DNA segment is correctly portrayed. This would save one a lot of work when dealing with the DNA segments.
LikeLike
Thank you! I created the bars for this blog post. I don’t do it for the thousands of shared segments in my spreadsheet – I rely on the sorted values. But others may be interested in seeing the data in a graph. From time to time I use Kitty Cooper’s graphing program to show TGs over all the chromosomes.
LikeLike
Jim,
In your fig. 7 how do you determine where the red bar should start and stop? I realize the beginnings and ends of the segments are fuzzy, but are you using a guesstimate for the actual ends of the red bar based on your experience?
Thanks
Greg M.
LikeLike
Greg – it’s a judgment call. Technically, using only the data of the shared segments, the red bar (representing the segment you got from an ancestor), should include the two yellow bars. In other words from the earliest SNP to the latest SNP in all the shared segments which Triangulate. But almost certainly these points are fuzzy – so I just selected something that “looked” about right. The actual start and end points of a TG are not critical. What’s critical are the Matches with shared segments in the TG – they are your cousins from a specific Common Ancestor. The way I handle this in practice, is to accept the start location for TG as the start of the first shared segment; then I use as end of that TG, the start location of the next TG. This gives a crisp start and a ragged end to each TG – just live with it. The ragged end is rarely as much as 2Mbp (about 2cM) – usually a fraction of a Mbp/cM.
LikeLike
Right, that makes sense. If I had thought of the entire range of the TG segment(s) that way, both red and orange portions, it would have made more sense. Looks like you just roughly eyeballed 10% of the start and stop as the fuzzy area.
LikeLike
I didn’t use a 10% “rule” – that seems way too large anyway. I looked for roughly what the majority of shared segments was saying. I just wanted to indicate that the true ancestral segment (the TG) is usually shorter than the full TG based solely on the most extreme shared segments.
LikeLike
Jim, I just came across your blog and am finding it very helpful. However, I must be missing something. Forgive me if I am asking something that you have covered elsewhere; if so, please direct me to the appropriate post.
I am still not clear about your division of 16A and 16B. There is a lot of overlap between the two groups as you divided them, why wouldn’t you include them all in the ancestral segment you have assigned to TG 16B? For instance, looking at fig. 4, why is M, at 51.6-60.6, in group 16B, while O, at 51.9-62.0, in group 16A? Matches P, F, B, C, D, F also overlap your 16B TG. To my eye, the natural division might be somewhere between those that start between ~26-32 and the group that starts between ~48-55. So what are your criteria for your grouping here?
Thanks for your help.
LikeLike
mizdnk,
You’ve hit on the hardest issue to understand with autosomal DNA. Our Chromosomes come in pairs – we get a Chr 16 from our father and a Chr 16 from our mother. Just looking at a shared DNA segment, we cannot tell if it’s on our maternal or paternal chromosome. However, all ancestral segments are on one or the other. Also all IBD shared segments are on one or the other. And, using Triangulation techniques, we can group our shared segments. So I took all the shared segments in the blog post and compared them – they fell into two groups, which I called 16A and 16B. I still don’t know which is maternal and which is paternal, but none of the shared segments in 16A matches any of the shared segments in 16B. This is segment (or genetic) Triangulation. We now have to use some genealogy to determine the “side” (maternal or paternal) of one of the groups. Knowing this, we know the other side goes with the other group. Hope this helps, Jim
LikeLike
Pingback: The Attributes of a TG | segment-ology
Pingback: Understanding and Using TGs | segment-ology
Thanks Jim,
you answered my first question quite adequately, didn’t mean to imply anything there. Thanks for the response to this question as well. My ancestry just took a big hit here, my tree on one line just collapsed. I guess on the bright side I’ll get to discover potential new relatives. Thanks for the advice, will start testing other family members. I use a spreadsheet too, some of the programs may be easier, but I like to understand how things works. Have a good evening,
Teresa
LikeLike
Hi,
thanks again for your blog. I find myself reading and rereading it until I grasp the concepts. It is invaluable to those of us just getting started. I have skill sets, I’m finding dna is not one of those that come easily to me. I’d asked you a question some time ago about which grandparents can be found on a chromosome.
The reason I asked was that I was getting matches to a surname that should not be on my mother’s maternal side, but is on her paternal side. I realize that she has two of each chromosome, one from her mom and one from her dad. But this was going way beyond what should be normal, and confusing me endlessly.
I re-read your articles on Endogamy and took your advice to run the Are Your Parents Related tool on Gedmatch with my mom’s results. Her mother and father’s parents came from different geographic locations, and there should have been no common links between them, and the one branch where there would no endogamy in play.
Imagine my surprise when the results showed that her parents matched exactly on 6 segments, over 5 different chromosomes, for a total of 136.7 cM, largest segment 43.5 cM. Only one match less than 10 cM, at 9.6, the rest vary between 17.6 and 25.6 cM. Is this one of your unusual exceptions in endogamy? Or am I interpreting this incorrectly?
Am I correct in assuming that there was a NPE somewhere in her background, and that these matches mean that her parents were cousins? I’m still scratching my head trying to figure out how this could be, but the dna doesn’t lie. Any advice you could give would be much appreciated. I promise I won’t keep pestering you with questions, but this one has me flustered.
I just this week tested one of mom’s half-sisters, they share the same mother. Is this the right course to take? Hopefully I can isolate her maternal side.
Thanks much,
Teresa
LikeLike
Teresa, I try to respond to all questions and most comments, but life gets in the way sometimes, and I get behind and lose track. You got pretty close to 1/4 of your DNA from each grandparent. If their ancestry had roughly the same size families, and descendants are roughly equally likely to take an atDNA test, then you’ll get roughly 1/4 of your Matches from each.
I’d say clearly your grandparents were cousins. And I’d be on the lookout for Matches who match both sides. I use a spreadsheet, and in this case I’d put a row in it for each segment your mother matches both sides – I’d put a bold name in like “WATCH OUT – COUSINS HERE”. Then any TG that includes this area must be analyzed very carefully. Look for known cousins in this area. And, yes, get as many 3C and closer as you can to test. Good luck!
LikeLike
Jim, Thanks for another very informative post. You finally have me realizing the importance of differentiating between ancestral segments and match segments. Do you sometimes use Don Worth’s Autosomal DNA Segment Analyzer (ADSA) on DNAgedcom for visualizing triangulation groups?
Jim H.
LikeLike
Jim, I use a spreadsheet, exclusively. I started that way and just keep going. There are several 3rd party programs – ADSA is a good one; there is also an iPad program. The goal of most of these is to group segments from a Common Ancestor.
LikeLike
Jim, I know you have promised a blog at some point on spreadsheet tips. In the meantime, I wondering how you do your visualization of TGs. I order the segments as you suggest, then in add a column that numbers them 1, 2, 3, … for a given chromosome. Next, select the number and segment start/stop addresses (as three columns together) for that chromosome and choose Insert/Chart/Stock High-Low-Close from the ‘All Charts’ window, but then need to click on the chart and ‘Select Data’ to remove the series with the order number, which gives me the chart I’m looking for. Have you found a better way?
Tom
LikeLike
Tom – I just look
LikeLike
Hi, thanks so much for your blog, it is a great help in figuring some of this stuff out. I’ve actually started identifying triangulation groups. I’m just getting started, and this is probably a really really dumb question. On an individual chromosome, 3 for example, are the ancestors represented usually from only one set of grandparents? Or can all 4 grandparents donate on the same chromosome?
Second question, which family members outside parents would be the best for additional testing, siblings, cousins, or aunts and uncles?
LikeLike
Teresa, thanks for your feedback.
You are correct that only two grandparents can be on the same Chr 3. You have 2 chromosome 3’s – one from your father, and one from your mother. The one one your father’s side is usually divided into about 3 or 4 segments which are from your 2 paternal grandparents – they always alternate: one segment from one grandparent, then one from the other one, then back to the first on. Your maternal chromosome is the same – alternating grandparents from her side.
I’d test aunt/uncles first, and then close cousins.
LikeLike
Thank you!
LikeLike
Jim – My sister’s results should be back in a week or two. I’m planning to plot her segments with our 34 known DNA cousins. At a minimum I should be able to figure out some crossover points that are mine and not the other persons. Were siblings any help to you? Rich
LikeLike
A little… I haven’t worked my brothers atDNA that hard. The main help he provides is when he and a known relative both have a Match that I don’t have. I that case I should have that segment on the parent’s side, but the other grandparent.
LikeLike
Jim, Great stuff! I had two ‘scratch my head’ moments on this one. The first was the same as DR Hunter about the 16A/16B dividing rationale, which you have explained — perhaps you could just add in a reminder at that point to direct people to the other blog that explains — for the uninitiated like me. Second was the statement: “The bottom bars will usually all match each other too, and they’ll usually also match the top 8 bars, but maybe R and N will not match at the 7cM level at GEDmatch.” Do you really mean R and N? Eyeballing those, I would expect substantial overlap of 16-17 cM, or am I missing something (which is not at all uncommon….). Or is it a typo and you meant R and M, or another one?
LikeLike
Thanks for the suggestion. Compare R and N to the bottom group.
LikeLike
You lost me at a couple of places.
First, how and where do you get the information in Figure 1? Do you compile it manually from 23andMe, FTDNA, and/or GEDmatch? Or is there someplace to download a comma separated values file that can easily be loaded into Excel?
Second, at Figure 4, how did you determine which individuals were 16A and which ones were 16B? You never explained why you made that distinction in the first place.
Third, in Figure 6, how do you make the colored bars appear? Is this an Excel function that I’ve never seen or used?
I may have more questions as I go on, but three stumbling blocks is enough to address right now.
LikeLike
D.R. – This post was one of a series. I’ve covered most of the background info in other blog posts. There are not very many of them, and it will help greatly if you start at the bottom of this blog and read up. I try to make my posts as “stand-alone” as I can, but I decided not to repeat a lot of info for this one – sorry.
The info in Figure 1 can be downloaded from 23andMe: Family Inheritance: Advanced – click on the download link; FTDNA: Chromosome Browser – click on the link to download all data; GEDmatch: try Tier 1 – copy the Match Segments list; AncestryDNA: you’re stuck – AncestryDNA won’t let you download your segment data.
16A and 16B are the same as TGA and TGB in the “How to Triangulate” blog post.
Figure 6 and 7 are pictures I created in Excel – for each line I inserted a rectangle, then sized and colored and located it into a bar that I wanted. Brute force! I took the time to do that so I could show how the data looks. I also highly recommend Kitty Cooper’s Chromosome Painting mapping tool at http://kittymunson.com/dna/ChromosomeMapper.php (be sure to donate to her if you use her program).
I’ve triangulated thousands of shared segments from my sorted spreadsheet – comparing them 2 at a time – I never use a chromosome browser any more (or a matrix, or other 3rd party software). But each person has their own way to analyze the data – many ways work.
LikeLike
Terri – you MUST keep a separate spreadsheet for each person. You can show the shared segments with all your relatives in each one, but they must be separate spreadsheets. I have one column for the base person (jvb in my case), because I sometimes combine spreadsheets to compare some areas and shared segments. But then I use that column to sort and separate the other base people out. I have a separate column I call “kin” and I put the initials of any close kin in that column whenever they also match a Match on the same segment. They are an automatic assignment indicator (and I color their cells pink and blue). So if you have a Match-segment that also matches your Dad or a paternal aunt/uncle or paternal 1C, you can be pretty sure that segment is in a paternal TG. You should also see the aunt/uncle or 1C shared segments nearby and overlapping. Usually siblings don’t help much here, unless you can tell which of their segments are on which parent’s side. And you’re correct there is often some additional info to eke out of close relatives – like a 1C who matches your Dad but not you – then usually the paternal segment you have at that location will be from your Dad’s other chromosome – the one not share with the 1C. It’s hard to say each of these guidelines works 100% of the time, but you’re catching on – and they work almost all of the time.
LikeLike
Jim, I did the triangulation that gedmatch has for my Mom’s sister. Just on chromosome 1 she had over 30 in one triangulation. Is that common? Keep in mind that their Mom and Dad were distant cousins sharing a great great grandfather.
Sandra
LikeLike
Sandra, It is common! I estimate we will each have an average of 400 Triangulated Groups over all 45 or 46 chromosomes. So if you have 4,000 Matches that would be an average of 10 per TG. But it will range from 0 in some places to 50 or more in other TGs. In fact if you used the GEDmatch Triangulation utility, you only got the some of the Triangulation Matches, but they are the ones with the most cMs. If you use Tier 1 one-to-many you can get many more Matches. I have some TGs with over 100 Matches. If a shared segment is over 7cM and Triangulates with several others in a TG, it is highly probable that it’s IBD (a true segment from an ancestor). All IBD shared segments have to go into TGs. So as the number of Matches keeps growing, we should expect the number of Matches in each TG to also grow.
LikeLike
Thank you. I need to get back to working her spreadsheet. We had a young lady contact us and was literally in tears because she found out her Dad was not her biological Father. Her Mom told her the story and gave her two men she had relations with The first one she did not match anyone in his DNA matches so she started looking at the second one. She and I matched so she asked my Aunt if she would do a DNA test and she agreed. What is puzzling is that if the second male is her Dad he would be the son of my Aunts first cousin. But she and my Aunt don’t match and she does not match my Aunts daughter either. Another puzzle is that my Aunt and I match her “step Dad”.
Sandra
LikeLike
Sandra, only a parent child (and identical twins) will match all across their DNA. Two cousins will only share some of their DNA, so it is actually probable that someone will match one cousin and not the other. The “step Dad” may well be a “person of interest”, depending on how much the match is.
LikeLike
Thank you for all of the work you have done. The posts are very helpful. However, I am still not clear on the rules for including a triangulation in a TG. Must each member of the group match every other member of the group to be included?
Here is an example drawn from my data that has me confused. These are overlapping segments, each sufficient to be IBD:
I match A B C D E F
and A matches B F
B matches A C
C matches B
D matches F
E matches A
F matches A D.
I think I understand that any segment must land in one of the 4 following categories, and that it cannot occupy more than one category: TG A, TG B, IBC/IBS, and U. What I don’t understand is how to categorize the matches listed above.
Thank you for your help.
Neil
LikeLike
Neil – in cases like this I draw a picture. All of your letters appear to form Triangles. But usually D would match A and B, etc. So I would look at the overlaps that don’t match. If you are using GEDmatch, lower the threshold to 500 SNPs and 5cM to see if they share there. If not, there may be something fishy. I’d want to understand why D doesn’t match A; or E to F – if they overlap enough, they should match.
LikeLike
Thank you, Jim. I did as you suggested, but the picture doesn’t change, although only two (A and E) are on GEDmatch. Everyone is on FF. I’ve set out the table as best I can below. (I did not set out a match grid because I can’t be certain all the matches will be aligned at your end.) I did miss indicating one match in my previous post (A and E).
Also, as additional information, this is on Chromosome 1; all are listed as my 5th to remote cousins, save A who is 4th to remote; B and C share the same last name and end point; and D, E, and F all have the same start and end points. I have triple checked all the values, as well as not only the ICWs, but also the NotICWs.
This is my first attempt to form triangulation groups, and I’m having a tough time. My basic question remains: must each member of a triangulation group match (triangulate with) each other member of the group? How many groups do I have here? Thank you for your patience. —Neil
Start End cM ICW
A 36.9 48.7 12.3 B E F
B 38.3 47.2 8.32 A C
C 38.6 47.2 7.76 B
D 39.3 49.9 8.41 F
E 39.3 49.9 8.41 A
F 39.3 49.9 8.41 A D
LikeLike
Neil
The shared segments are all in the 7-10cM range. Since they don’t match each other where they clearly share enough DNA, I’d conclude they may be IBS. A close second opinion is that they DO match each other, but don’t pass the 20cM total requirement at FTDNA. That’s why is so important to upload to GEDmatch and check there. If at GEDmatch you find 50-100 Matches like this, (under 9cM and in a tight area), then it’s a bad pile/up – almost all IBS. To answer your specific question, all the shared segments in a TG don’t have to match every other segment in the TG. But if they overlap enough (matching criteria) they should.
Jim – http://www.segmentology.org
>
LikeLike
Jim,
I LOVE this post! Your explanations and graphics are amazingly helpful in furthering my understanding of triangulation and how to analyze my results. I appreciate that you’ve included examples with ambiguity–it helps clear up areas where I’ve gotten hung up. I will read and re-read this.
A “mechanical” question that is still rolling around for me and I hope will be covered in one of your future posts is how/whether to deal with the results for immediate family (parents, siblings, aunts/uncles, 1C). I administer several tests, and I’m afraid I’ve confused myself by creating a list including their segment matches AND mine rather than their segment matches WITH me. I know there is good additional information to be gleaned from their results, but I haven’t quite sorted out in my mind how to eke that out (aside from identifying whether a match is maternal or paternal–Triangulation Group A or B, which is a great start.) I do realize that the results from these family members can identify additional familial matches who share a common ancestor, but I think I’m muddling my effort to map my own chromosomes.
Thank you!
Terri
LikeLike
Anatomy of a Triangulated Group — in case you missed it.https://segmentology.org/2016/02/05/anatomy-of-a-tg/
LikeLike
Really good post — very clear. I like the example of basic use of a spreadsheet like Excel to organize the workspace. Using Excel, you can print out your work at various steps (like figure 7) and mark it up by hand, but then edit it in Excel and print out a new version.
LikeLike
Thanks for the feedback, John. I have to remember each person has their own methods and tools that they are most comfortable with. It’s good to see the concepts getting out and being understood – as well as the different ways to analyze the data.
LikeLike
Nice post Jim. Is there a reason why you are using excel instead of Genome Mate ? I can imagine that some of the functionalities provided by Genome Mate will make your segment analysis much easier? Or are there some options that you miss when using Genome Mate?
LikeLike
EJ – thanks for the feedback. It’s all about the tools we use. I got started with Excel at the very beginning. I like working with the data (instead of a program doing something in the background). Over the past 6 years my spreadsheet has grown from one page with 50 rows to over 8,000 rows. And I’m out to column CF… I can control what’s in the spreadsheet, and manipulate it any way I want. Yes, most of my sorts are covered by GenomeMate. But probably the most important factor for me is getting to know each Match and row/segment they bring to the puzzle. I get a feel for how they fit. As I enter the data I can now almost always correctly guess which side they are on. And I see the patterns in a TG as I’m typing and thinking what I’m going to say to this Match. After all, it’s not data – these are my cousins, and I’m a genealogist who wants to share and explore with each one. This really is a big jigsaw puzzle for me – I can’t let a program solve it for me.
But for many, the several programs and tools are very helpful – I think GenomeMate is a great, clever, workhorse of a program. I would not hesitate to recommend it.
LikeLiked by 1 person