
This is a guest blog post by Dr. Ann Turner, who has been a great mentor for me.
Anatomy of an IBS segment
Ann Turner
DNACousins@gmail.com
October 1, 2015
Jim Bartlett, my host for this blog post, shares a 7.8 cM segment at 23andMe with my nephew Larry. This was a serendipitous find, for Jim broke down a brick wall for me with records from an orphan’s court. In turn, I provided a solution to a minor mystery for Jim – where did John Henry go when he disappeared from Frederick County, Virginia?
That discovery was back in 2011, before we had developed much in the way of techniques to analyze segment data. There was one troubling aspect: Jim did not match my sister (or her husband, either). This could be explained away if there was a false negative in my sister. Fast forward to 2015. Jim’s intensive work on triangulated segments has filled in the section containing Larry’s segment with more cousins. Larry did not match anyone on either one of Jim’s chromosomes.
Is it possible that this match was not Identical by Descent (IBD), but just Identical by State (IBS)?
A Terminology Detour
The terms “Identical by Descent” and “Identical by State” predate their application to segmentology, Jim’s felicitous term for analyzing autosomal DNA. The glossary in Human Evolutionary Genetics[1] contrasts the two phrases:
Identity by Descent: Property of alleles in an individual or in two people that are identical because they were inherited from a common ancestor; as opposed to identity by state
Identity by State: Property of alleles in an individual or in two people that are identical because of coincidental mutational processes, and not because they were inherited from a common ancestor (identity by descent)
In effect, “identical” is the more general word, and the phrase describes two mutually exclusive ways of achieving identity – BY state or BY identity.
Also, the definition is about alleles, alternative versions of a single marker. There are examples in genetic genealogy when we look at the type of DNA that follows one line, the straight paternal line or the straight maternal line.
For the Y chromosome, the ancestral haplotype may sometimes be deduced from multiple lines of descent. The question then becomes whether a variation on the theme marks a specific line: does the fact that two individuals both share a one-step difference from the ancestral haplotype on DYS19 mean that they have identified a branch tag to a more recent common ancestor (the mutation is identical by descent), or did the mutation occur independently in two different lines of descent (the mutation is identical by state)? The mutation rate is high enough that either explanation could hold true.
For mtDNA, there are certain hotspots where a mutation is not a reliable indicator for defining haplogroups or even genealogical relationships. A mutation 16519C has occurred independently hundreds of times in different haplogroup subclades, and insertions at 309.1C (and 309.2C) are frequent enough that even siblings are known to differ.
Adapting the two terms IBS and IBD for segmentology stretches the original context to include regions of the genome, not just single markers. Furthermore, the mutation rate for autosomal DNA is orders of magnitude lower than Y-STRs or mtDNA. Differences in two autosomal markers are not likely to be due to a recent mutation.
With this shift to testing multiple autosomal markers, some authors began to employ the phrase Identical by State as the broader concept. Then some, but not all, IBS regions would also be Identical by Descent. That leaves a vacuum – what should we call regions that are IBS but not IBD? Charles Brenner created his own term, which is not particularly evocative but illustrates the frustrating dilemma:
“Identical by state” (IBS) as used here is synonymous with “identical”, an umbrella meaning in that IBS thus includes IBD as a subset. Adopting the umbrella definition for IBS means some other term may be needed to mean IBS but not IBD and for this purpose I use the word “strict.”[2]
Indeed, it appears that many technical articles avoid the term IBS entirely. A search of Google Scholar yields 17,100 citations for Identical (or Identity) by Descent but only 4,700 citations for Identical (or Identity) by State. Scanning a small sample of those articles reveals that they often describe a segment as IBD or “not IBD”, period.
My personal preference is to hew to the original concept, where identity is the broader, more general term. It avoids the awkward need for a special term to describe IBS but not IBD. Plus in the future, when we can do whole genome sequencing, reserving IBS for accidental identity due to a parallel mutation may become more relevant. In spite of the low mutation rate, the vast number of loci and (perhaps) the large number of tested people will result in a certain number of recurrent mutations. We are already seeing this with more comprehensive sequencing of the Y chromosome.
I have no objections to those who prefer IBS for the more general term, but for the purposes of this blog post, I mean Identical “just/merely/only” by State. For further clarity, we need to emphasize that we are speaking of HALF identity, where at least one of the two alleles in one party’s genotype matches at least one allele in the other party. Leon Kull coined the acronym HIR for Half-Identical Region. That obviously leaves a lot of wiggle room, as shown in the next section.
Dissecting the Segment
Jim graciously shared his raw data with me so I could use Excel to view each and every one of the 850 SNPs in the segment. (See Supplemental data file.) The segment boundaries are opposite homozygotes (e.g. CC and GG) – they do not match at all. Figure 1 shows some of the column headers in the spreadsheet with a few sample rows of data.
Columns A, B, and C give the chromosome number, chromosome position, and SNP ID as found in the raw data download. They are redacted here for privacy reasons, but the column labels are preserved for those who would like to use the spreadsheet as a template for their own analyses.
Column D is for Jim’s genotype data. If Jim is homozygous for a marker (e.g. CC), then he obviously received a C from his father and a C from his mother. If Jim is heterozygous possible alleles are always listed in an arbitrary order (often alphabetical). The C allele could have come from his mother and the T allele from his father, or vice versa. Columns E, F, and G are genotype data for Larry, his mother, and his father.
I also phased Larry’s data so I could tell which allele came from which parent, using David Pike’s utility Phase a Child when given data for child and both parents for the calculations. In a separate step (not shown here), I reformatted the results and loaded them in to the spreadsheet so the rows aligned with Jim’s results. Column H has the maternal allele (from my sister) and Column I has the paternal allele. The results could not be phased in cases where all three parties were heterozygous, and the genotype is retained. A heterozygous result is a universal match – no matter what Jim’s genotype is, at least one of Larry’s alleles will match at least one of Jim’s alleles, because each SNP has only two possible versions.[3] The full spreadsheet can be seen at this link.
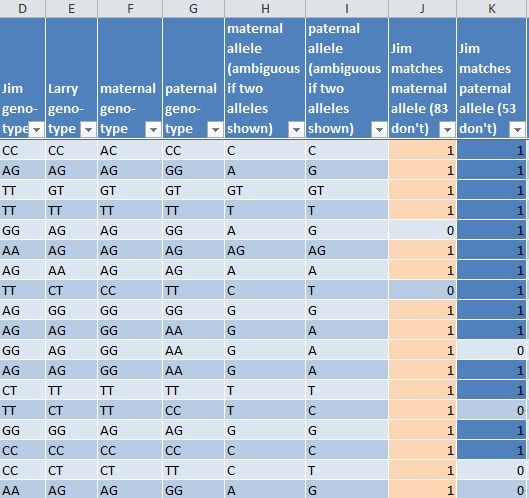
Figure 1
Columns J and K use Excel formulas to show whether Jim matches the maternal allele and/or the paternal allele (coded with a “1”). Conditional formatting shows pink for a maternal match and blue for a paternal match. It’s readily apparent that a mismatch in the maternal side is filled in by a match in the paternal side, and vice versa. Figure 2 shows this pink and blue pattern horizontally (similar to a chromosome browser) for a somewhat longer stretch of 31 SNPs.

Figure 2
The remaining columns in the spreadsheet (L through T) contain calculations used to generate some summary statistics:
1) The apparent long run of 850 half-identical SNPs is broken up into 61 shorter runs on the maternal side and 31 shorter runs on the paternal side. It is entirely possible that these runs would be fragmented even further if Jim also had phased data.
2) Jim and Larry are both homozygous for the same allele for 368 of the SNPs. If Jim inherited the same allele from his father AND his mother, and ditto for Larry, it seems likely that the allele is rather common in the general population. That makes for easy pickings.
3) Jim is heterozygous for 310 SNPs and Larry for 311 SNPs, about 36%. There are 482 SNPs where at least one party is heterozygous (57%). These are universal matches.
Most segments of this length will actually be IBD.[4] This example is somewhat exceptional, deliberately chosen to dramatize the possible pitfalls and serve as a warning about smaller segments. One explanation may be that the 36% level of heterozygosity happened to be particularly high for this one region. The overall average for Jim and Larry was 28.2% and 30.7% respectively
Red flags were waving for this segment: the lack of triangulation and the lack of a match for both of Larry’s parents. Is the converse true? Can triangulation or a match in a parent prove IBD? No, many counter-examples can be found, especially at shorter segment lengths.[5]
Phasing is our most pressing need, yet it is not always available.[6] Any alternative methodology for claiming that certain short HIRs are IBD must be able to demonstrate that the segment survives in test cases where the phase is known.
One more moral of the story: a genealogical connection can be made without DNA!
[1] M.A. Jobling et al, Human Evolutionary Genetics: Origins, Peoples & Disease, Garland Science, 2004.
[2] Brenner CH. Understanding Y haplotype matching probability. Forensic Sci Int Genet. 2014 Jan;8(1):233-43. http://dna-view.com/downloads/documents/Understanding%20Y%20haplotype%20matching%20probability.pdf
[3] It is possible to have three or four alleles (A/C/G/T) for a SNP, but these are rare and SNP chips tend to avoid them.
[4] According to 23andMe’s simulations “IBD segment lengths [i.e. HIRs] greater than 7 cM were observed 90% of the time in at least one parent. Preliminary data suggest that 7 cM segments shared between a distant cousin and child that were not observed in the parents were due to false negatives in the parents.” Henn BM et al, “Cryptic distant relatives are common in both isolated and cosmopolitan genetic samples.” PLoS One. 2012;7(4):e34267.
http://www.ncbi.nlm.nih.gov/pmc/articles/PMC3317976/
[5] See my blog post http://www.thegeneticgenealogist.com/2015/03/30/guest-post-what-a-difference-a-phase-makes/ for details on how an experimental phased data file eliminated a large number of small segments reported by Family Tree DNA.
[6] AncestryDNA phases data for its internal calculations, but the raw data download shows genotypes with the alleles in an arbitrary order.

Pingback: Five Takeaways from an Advanced DNA Institute Course – Family Locket
Pingback: How many short matches do you need? – Long Story Short SNAPS
This is an excellent post for explaining how exactly a segment can be “IBS.” If it seems counterintuitive that a run of HIR’s could (in one case) by IDB and (in another) be IBS, this shows exactly how (and why) that happens. Thanks, Ann Turner!
LikeLike
Barton, this is one of the toughest hurdles to work out – is a shared segment IBD or IBS. And the smaller the segment, the harder it is.
LikeLike
Pingback: Published by Segmentology: Anatomy of an IBS segment | GraveSeeker's Diary
Pingback: Missing and Small Matches | IowaDNAProject