
The Shared cM Project is an important and powerful tool for genetic genealogy – particularly with it’s integration with the DNA Painter tools. Over 60,000 submissions is impressive.
Two observations on the Shared cM Project – a very high percentage of the submissions were for the closer relationships; and the data was from many different users (perhaps with varying degrees of accuracy).
I now have over 9,000 entries in my Common Ancestors spreadsheet [see my blogpost about this spreadsheet tool]. I’ve curated these down to 7,800 entries from 1C to 8C, that I am pretty confident are correct. Also, my analysis is that there is a high probability, based on Trees and Shared Match Clusters, that each shared segment is from the Common Ancestor.
So I decided to compile cM statistics from my own curated data. I also wanted to see how the small cM relationships played out.
My data is not nearly as robust as the Shared cM Project was for 4C and closer relationships. However, in the 5C range my data was closer; and in the 6C to 8C range I generally had more data points than the Shared cM Project. This reflects my emphasis on all Ancestors out to 8C range.
Overall, there were no big surprises. In general, for 6C to 8C my data was in a tighter range; and I had some data for distant relationship that weren’t in the Shared cM Project (but, no surprises)
Bottom Line: In my opinion the ranges in the Shared cM Project are a little broad – probably a reflection of data from so many sources. I think the broader ranges give folks more wiggle room with low percentage probabilities, when they should really be looking for other possibilities.
Here is my table comparing my data with the Shared cM Project data – the top row indicates the full cousinship; once removed (1R) and twice removed (2R):
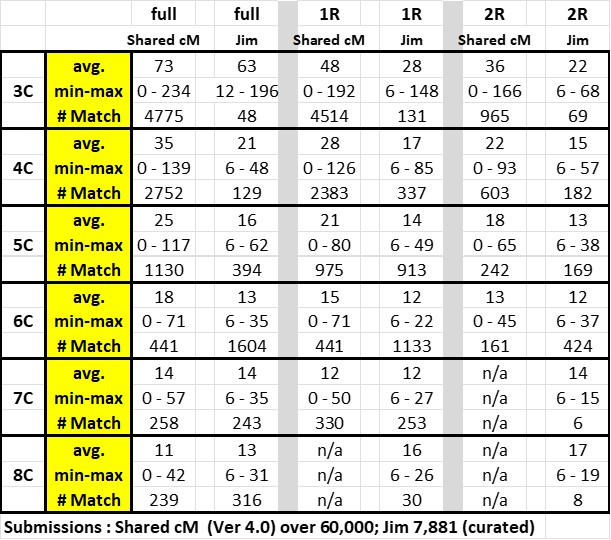
The significant increase in data points at the 6C level reflects the power of ThruLines to build Trees back (subject to my review); but only out to 6C.
As always, feedback is welcomed.
[06F] Segment-ology: Shared cMs for Small Segments; by Jim Bartlett 20420605

A question about my smaller DNA matches on Ancestry.
I have 5 DNA matches at 20cM and they all match each other.
We all have one segment.
Is it safe to assume that this is the same segment?
LikeLike
Jen, The quick answer is no. It’s not “safe”. When Matches all match each other, that is a strong Cluster, which is usually from the same Common Ancestor for all – particularly if the segment sizes are very roughly the same. However a Cluster is not the same as a Triangulated Group (which is built on one segment. Often, a Cluster and a TG have the same segment, but not always. Jim
LikeLike
To add: why do you want to know if it’s the “same” segment? In some cases I know the segment of a few Matches in a Cluster (like you have); and, if there is concensus, I do impute that TG to the other Matches. If the consensus TG is say [04S24] I’ll add 04S24c to the other Matches – the little “c” telling me it’s a calculated guess. Most of the time further info reinforces this – but sometimes reveals a conflict. Jim
LikeLike
Interesting! Thank you for sharing.
LikeLiked by 1 person
There are always some interesting points to ponder in your blogs.
LikeLike
Thank you – makes me smile;>j
LikeLike
Your average values align better with my theoretical (simulated) data than the SCP does. I get broader ranges than you do; then again, I’m simulating 50,000 matches so that’s to be expected.
-Leah “Kiddie Pool” Larkin 😉
LikeLike
Leah, Thanks for your comments. You have definitely “done the work” and are in the deep end of the pool. I get the broader ranges using large, simulated, data; but I think we need to narrow the probable range – particularly since so many newbees rely on the SCP. I took out a few outliers, and the SCP does too – I think more is warranted. When anyone is in a fringe area for a relationship, they really should be looking harder at more realistic relationships – see the horses/don’t focus on the zebras. Thanks again for joining in the conversation. Jim
LikeLiked by 1 person
Agreed. The extreme ends of the distribution are interesting curiosities but not where we should be focusing our energy. I can calculate the 95% confidence intervals (basically 2 s.d.) on my simulated data, but it’ll take a while.
LikeLike
Jim,
Just want to thank you for the work you do. I enjoyed this and other posts you’ve done and admire your work. I’ve been a bit discouraged from posting on the various forums lately after getting some pushback on the utility of small segments when they cluster. I spend a lot of time with the shared clustering app and have used it to find all sorts of useful things at the 6C+ level. It’s just good to see your work.
Brian
LikeLike
Brian, Thanks for your kind feedback – it keeps me going… Well over 99% of all folks who have taken a DNA test (maybe 45 million now), are uninterested and/or have genealogy as a hobby. As a hobby, there are no rules. Perhaps some suggestions or guidelines, but no rules. Professional (for pay) genealogists should adhere to some guidelines to protect the profession. [NB: I am a registered Professional Engineer, and in that work I must follow the rules and code to protect lives.] A few of the genetic genealogy “leaders” are concerned that almost all DNA testers don’t understand it enough, and they should be kept in the ‘kiddie pool” – my sarcasm, and I’ll probably be sorry for it. However, they do have a point – many folks who don’t understand genealogy DNA, find a Match and a Common Ancestor, and conclude they prove each other; and they put DNA icons in their Tree to “certify” that their line is correct; etc., etc. Such is the nature of hobby genealogy. We have to be careful of their Trees whether they offer DNA claims or not {Ancestry, LDS, and others had plenty of incorrect Trees long before DNA came along…]
I’m glad to see you, and other “Segmentologists” venturing into the deep end of the pool. As we work through our experiences (successes and failures), we’ll develop the methods that work. Our own DNA is static, and each segment came from an Ancestor – we just have to tease it out.
Thanks again for your comments, Brian. Sincerely, Jim
LikeLike
I’m an engineer by day also – though not a PE. You frame it well, kidde pool. The general statement “small segments aren’t useful”, has some truth to it, a lot of small segments aren’t. But those that cluster are gold for doing any research past the 4th great grandparent. When I try to explain some of my techniques online – I get the equivalent of blank stares or people wanting to argue (showing they don’t understand what I did), even when some of those people do this for their occupation. I’m contemplated doing a blog, and even set up an account to do so, but, it’s not happened. Cheers to you for doing your part.
I was later to the game than you on this I think (it’s been about 7 years since I bought my dad a DNA test for Father’s day). Hard to say how much time I’ve put in, but several thousand hours of categorization/annotation since then. The answers to the hard questions take a lot of background work that’s well past what most people have time/willingness to do. Again.. Thanks!
LikeLike
I should quickly add that I spent several years in the genetic “kiddie pool”. I did Y-DNA in 2002, and all the major atDNA tests as they rolled out. From 2010 to 2012, I was focused on finding Common Ancestors with DNA Matches. When I got to 100 in 2012, I started a spreadsheet – and, on a lark, noted the Chr # and cM amount – I didn’t have a clue what it meant. I remember Ann Turner and Tim Janzen as leaders and teachers, and as a community we bootstrapped ourselves. I believe we are still on the frontier; and I’ve seen many swim out of the kiddie pool to deeper waters, as it were. You and I, and a growing legion, are still testing the waters…
As I muse, I think of the scientists that study genes for medical reasons. Alternately, I think there is a puzzle gene which I got from my engineer dad (but my brother didn’t), 2 of my sons got it, and at least one granddaughter – they can all figure out 3D put-together puzzles. I wonder if it will be scientists or genealogy sleuths who will find the “what’s in it for me” gene; or the “how can I help others” gene… wouldn’t that be a hoot? Jim
LikeLiked by 1 person
Brian – to your “small segments when they cluster” comment: the proof is in the outcome – those clusters almost always lead to additional Match cousins on the same Ancestral line as you – a BINGO! THE UTILITY OF SMALL SEGMENTS WHEN THEY CLUSTER should be in all caps – a very succinct way of summarizing a concept that works! Jim
LikeLike
On your 3D puzzle comment. Well, isn’t that interesting. My unique skill (which 2 of my brothers and father have as well) is the ability to see how systems fit together along with pattern recognition. I am actually quite under average when it comes to 3D physical puzzles (which is why I’m chemical not mechancial engineer I suppose). As it pertains to our discussion here, I can recognize the patterns in the shared matches and I’ve learned over time what those patterns usually mean, though it’s difficult to describe so it makes sense.
As to your second comment – very validating to see you get it and that your experiences mirror mine.
When we look at where this could go, I’d agree we are still in the early ages, though it felt like there was more pioneering working going on before Ancestry started putting out the C&D letters. The limitations of my techniques are all around bad/incomplete trees and unlinked trees – there is so much that could be done there.
I’d also comment that one of the weaknesses of my techniques vs what I perceive yours to be, is since I work 90% of the time on Ancestry, and we only have easy visibility to +20cM shared matches, is that any cluster I want to analyze that has shared matches with small segments – has to have at least 3 matches above 20 cM (my minimum definition for clustering). I’d imagine with identifying triangulation groups with chromosome data that you could dive deeper than that.. Still, the above 20 cM have plenty of mysteries that take lots of time to solve in my experience.
LikeLike
An observation: the genealogy is at Ancestry (but no Triangulation); Triangulation is possible at 4 other sites (but virtually no genealogy tools). I’ve found a bunch of Ancestry Matches at GEDmatch, so I can link some Clusters to TG segments – but it’s not a one-to-one relationship because Clusters tend to form on Ancestors, and TG segments are all along a line (maybe several Clusters).
LikeLike
Brian – re above 20cM SMs… I developed and blogposted a Walk The Clusters Back (WTCB) process – Starting with linking our largest Ancestry Matches to grandparent Clusters and creating “tell tales” for each Match; then lowering the Cluster threshold some to get more, and more distant, Clusters – the “tell tales” tell us which grandparent, other cousins usually tell us the next generation back – providing new “tell tales”. I was able to work this down to virtually all of my 20cM Matches with strong indications where each was in my Tree (even those without Trees). I could then investigate under-20cM Match, as you did with at least 3 who formed a consensus based on their above-20cM Shared Matches. This process also identified some small Matches which had very mixed SMs – which I then classified as probably false… (my form of Triage). This kind of analysis is just one of the steps in validating small segments and CA relationships.
LikeLike
Closest I can come to your triangulation post, is this little thing I did for Jonathan Brecher years back, one of my earlier projects. https://github.com/jonathanbrecher/sharedclustering/wiki/Clusters-represent-shared-segments
I’ll take your word for it on Triangulation Groups because other than the above, I’ve not done a lot with it. I’ve done a ton with the shared clustering app though, and I suppose because I’m so familiar with it, it’s where I play. Whenever I find a match on one of the services with a chromosome browser that is also on Ancestry, I annotate it on the notes for that match. I believe every single time when I compare single segment matches on a cluster – they are always on the same chromosome and in the same vicinity on that chromosome. And I think I’m saying the same thing you are, but correct me if not.. On that cluster when I build out the trees, I find a large amount of them all landing on the same ancestral pair, with a few being a generation or two earlier, and few being a generation or two later.
LikeLiked by 1 person
Brian, I, too, worked a lot with Jonathan as he developed his program. I had already Triangulated all of my shared segments at FTDNA; and he helped me to then Cluster them all. A great data set. There was a lot of correlation, but not 100% one-to-one. So I reviewed the entire data set, one by one. Segments Triangulate in only one, very specific, way. Clustering is a “softer”, heatmapping, type of analysis because each Match could group with more than one other Matches – sometimes several. Clustering accounts for this with “gray” cells that link to other Clusters. I reviewed my data set, and by looking also at gray cells, I was able to find over 99% congruence. This was comforting for me and Jonathan.
The thing is that Segment Triangulation is based 100% on the DNA segments, and the TG segments have to be on one path (ancestral line) with respect to me (genealogy is not required to form TGs). Clustering is based on genealogy (among a cadre of DNA Matches who tend, strongly, to group on a single Ancestor (in most cases a couple). But that Ancestor may have been the source of several DNA (TG) segments. I formed 372 TG segments – on average about 1/4 came from or through each grandparent; 1/8 through each Great grandparent, etc. At 8 generations back, I have 256 Ancestors, so at that generation, or so, I’d expect about 1 TG per Ancestor. Closer than that, I’d expect to see Clusters (and Ancestor families) which could include multiple TGs. Jim
LikeLike
Jim,
While you’re on this subject I’d like to get your opinion on something that’s bugged me for a while about the numbers on the Shared cM project, which will also affect your calcs.
The input data that is used is actual values from dna testing companies but this data is artificially truncated by the companies at 8cM. I understand the reasons for this are to remove matches likely to be false (IBC) but the fact is they are also removing matches that are perfectly correct.
This has the effect of skewing the averages (and minimums) for the groups that cross the truncation point upwards. Whether this goes on to affect the predctions I have never been able to discover.
As an example compare their numbers for 1C and 2C: For 1C down to 1C3R the averages more or less half at each generation (as expected); but for 2C down to 2C3R as soon as the truncation point is in play the averages are higher than expected (2C3R is 51 rather than expected 30ish)
What do you think ?
LikeLike
Bear in mind that even 1C and 2C share segments less than 7 cM (or whatever threshold your particular company uses). Those sub-threshold segments are being thrown out before the total is calculated, only we don’t notice because there’s so much natural variation in match amounts and because it doesn’t really affect how we evaluate relationships that close.
LikeLike
The 1C and 2C example was just to illustrate the effect, It’s really more about the further out relationships. For Ancestry & MyHeritage the single small segment threshold seems to be at 6cM (with 8cM as the total cM threshold) so the effect is less, also it disproportionately affects more distant cousins.
Really what I’m saying is that the truncation of the data is an artificial effect created by the testing companies and nothing to do with the underlying process. It’s like carrying out an experiment using an instrument that doesn’t cover the range of expected values. If that was the case I would try various methods to minimise the effect.
LikeLiked by 1 person
Short of sequencing each DNA strand separately (very expensive), how could the companies minimize the effect? A more realistic approach for now is to adjust our expectations. Ped-sim simulates perfect segments, so it’s fairly easy to extract expected values for different segment thresholds. For example, in my recent blog post, I used a 7-cM threshold. https://thednageek.com/low-matches-lie/
LikeLike
Leah, if I could only get you just as excited to “ped-sim” Segment Triangulation and give us a curve for IBD vs False segments….
LikeLiked by 1 person
Jim, I’ve actually tried simulating triangulations for 2C. Unfortunately, I don’t have the programming skills to bulk-process the output. If you (or anyone you know) can help with that, I would LOVE to collaborate! That’s precisely the sort of analysis genetic genealogy needs right now.
LikeLike
Leah, It’s funny – I went off to college to be a nuclear scientist, but my new freedom (partying) got in the way of learning a language required in Arts and Science. At the end of year one, someone told me that engineering allow programming as a language >> “sign me up” and I got a BSEE (and loved Fortran, etc.). But in 45 years of work, I never did any more programming…
LikeLiked by 1 person
Leah – I cannot help myself – only *some* low Matches lie…
LikeLiked by 1 person
True, only some low matches lie. The trick is finding the “honest” ones in a sea of dissemblers.
LikeLiked by 1 person
Steve, the testing threshold is “created” by the companies – I agree. I think it’s a combination of “reduce false segments” and “reduce company workload”. When Ancestry went from 6cM to 8cM threshold, a significant number of Matches were deleted (I saved a few thousand). I’m sure at 25 million kits, it saved them a lot of computing – which computing, IMO, would be much more productive in the new features they are rolling out. [and, oh how I’d love a browser, even for pay/opt-in/above-20cM only]
For genealogy DNA, I think the lower levels are reasonable – I’m retired and a power user at Ancestry, and I still cannot keep up with finding new MRCAs. It’s been a couple of years since I’ve been back to the other companies to update my new Triangulated Matches…:>(
LikeLike
The “sea” is not uniform over the range of cMs – it shrinks, dramatically, from 6cM to 15cM…
LikeLike
Jim, I can’t for the life of me figure out how to reply just to your reply on here so I’m replying to myself in response to “Steve, the testing threshold is “created” by the companies – I agree” !
I’m yet another retired Engineer but I did spend the last 30 odd years programming.
The choice of threshold doesn’t affect the processing, you compare two sets of data to get an amount in common then test it against a threshold, it’s the same regardless of the numerical value. Lower thresholds would give more results and hence require more storage but all you would need to store would be a numerical index to the matches that passed the threshold. Compared to the storage required for the actual dna results it would be trivial. Similarly for the 20cM limit that drives me crazy, I’ve only got about 450 matches over that limit and about half have no tree, of the remaining ones I’ve identified about 80% and the rest are just an occasional torture if I feel masochistic.
LikeLike
Steve, how to reply confuses me too!
The lower levels (6 and 7cM) amount to a significant percentage of the total. By experimenting at GEDmatch, a 3cM threshold generates a *match* with almost everyone – and a combination of “way beyond a genealogy horizon” and “outright false” effectively gives us garbage in….
And, IMO, the companies are doing us a favor with the limits. I don’t think our Genetic Genealogy community could deal well with full data.
I, too, wish they would lower, or drop, the Shared Match threshold. Only 4% of all my 94,000 Ancestry Matches are over-20cM.
LikeLike
Steve – the fly in the ointment is this – the ADNA data is an unknown mixture. Of 600,000 tested SNPs, there are two values for each one – what you got from your parents. Four possible values A, C, G, T. So 10 possible pairs for each SNP. From the data set, we don’t know which of the pair is from which parent. The matching algorithms, do make a comparison at each site, looking for a string of Matches. In the short run, they could match a C from my mother to the Match and at the next SNP match a G from my father to the Match. This would be a false match (because the “string” is not on one chromosome from one parent. So we insist that the algorithm find a long string of Matches, such that the long string could only be on one side (chromosome) of our own DNA. We generally accept that about 50% of the 7cM “matches” are True, and 50% are false (you can find all kinds of estimates, but the point is the data is not close to 100% true). So the “in common” data is not a given for shared segments below about 15cM. IF we can determine phased data, we can assume all the matches are correct (but then we have to contend with how far back they originated at a Common Ancestor) – not an issue for the math, but it is an issue for how useful the segments are. Ancestry claims they can look at our DNA results and phase it using big data comparisons – I’ve found it accurate over 20cM, and really iffy below 10cM (which is where we really need it the most)… Jim
LikeLike
Jim,
Now that you mention Ancestry phasing, I have always thought that Ancestry could at least partially phase our dna by using an automated version of your methodology and a bit of added statistical analysis. After all they have access to all of our matches and know exactly which ones triangulate and where and which ones don’t. They could cluster all the segments into Parent A, Parent B and Don’t Know groups with those in a Parental group (at both ends) being almost certainly IBD.
LikeLike
I agree, Steve, but I think they are sensitive to our being able to trace genes in their customers – I think that’s their line in the sand. Jim
LikeLike
Hi Jim,This chart is good as it shrinks the range of the cousin matches, might help pin down the relationships more. Thank you.Debbie
LikeLike
Debbie, Thanks for your feedback. I like it too, as too many people accept the fringe values and quit – when they really should be searching for alternatives… IMO. Jim
LikeLike
As always, love your work. Another great reminder that small segments can be useful and valid – but you need to do a lot of work to be able to be reasonably confident! Something most aren’t willing to do.
I have been reading comments on other sites recently saying things like – you can’t use autosomal DNA past a certain relationship or that segments below a certain amount should be ignored. This irritates me, because if you are looking to confirm your pedigree, you need to be looking at smaller segments to find and confirm them, but the search needs to be targeted and hypotheses confirmed from varied sources, phasing, triangulation and supported by shared clusters etc. I’d be interested to know the average (or one of those ‘m’ words!) for your min/max segment size for the distant relationships.
Really interesting to see the total number of your identified cousins and how few have been gathered at the more distant cousinship levels in Shared cM project.
LikeLike
Oops – now see the average is there
LikeLike
Veronica, Thanks for the kind feedback. I, too, am concerned with leaders who focus on roadblocks in genetic genealogy. I can understand warnings to folks who are beginners, but I also remember the “starting blocks” we were in in 2010 as test tested at 23andMe and FTDNA. I spent the first two years just “collecting” my first 100 Common Ancestors, without a clue about what the DNA segments had to do with it. But gradually we literally “bootstrapped” ourselves into the genetic arena. And what a wild ride it has been SO FAR (as Diahan Southard put it). Perhaps my life experience has taught me to push the limits – recognizing there may be some false starts and many rabbit holes (my “icicles” were a dud, but we finally got Shared Match Clustering to work)
I am more convinced than ever that atDNA is a great tool that is effective out to at least 8C. I have some beyond that, but the genealogy documentation gets a little thin in Colonial Virginia. It will be interesting to see if the next iteration of the Shared cM Project shows an increase in data for the more distant generations (beyond my own submission to them).
Thanks again, for your continued support of Segmentology. Jim
LikeLiked by 1 person
Thanks for this, Jim! I always enjoy your blog posts. I’m wondering with your data how you account for multiple relationships and pedigree collapse. When you know the connection to say, a 4C, might they possibly be related to you in multiple ways? I think part of the skewing (or broadness) in the Shared cM Project could be the inability to account for, e.g. double cousins, or even that the submitter was not aware of more than one of the relationships. These instances would result in higher shared cM values, but would incorrectly list the relationships as single. E.g. 1500 cM could be a double 1C (adjusting out the FIR).
Of course, if you only share one segment, that would come from only one of the connections. But statistically that means the others resulted in no shared DNA, so should still be reported I would think. Another cause of the skewing is likely because people don’t bother reporting (or didn’t know about) relationships where no DNA was shared.
LikeLike
Good comments, thanks. In my case most of the 5C to 8C are single segments. It is 4 times more likely at almost any small cM to be a 4C over a 5C. So I lean toward the closer cousin when I’m related multiple ways. Also, in my spreadsheet I have many Matches under each surname – so when they show up as Shared Matches to each other, that gives me a good clue. Of course I cannot guaranteel 100% accuracy – but usually close. Close enough for this kind of overview. Jim
LikeLike
I should add that the Shared cM Project has these same, ligitimate, questions – it’s hard to use crowd sourced data, and keep it pure. That’s the great advantage of a very large data base. We will never be precise, but, with large numbers, a pretty valid picture comes into focus.
For this kind of chart, we focus on the relationships with DNA segments. In other ways we look at the null aspects. For instance that 10% of true 3C will not match; or 50% of 4C will not match. I’ve actually posted about techniques to use this valuable null information. But it would be very hard to round up a lot of data on non-Matches.
Jim
LikeLike
I am remiss in not addressing the issue here. The Shared cM Project (and my data) tries to show a link between cM and relationship. However, in life, it’s not always such a simple thing. Even with one DNA segment, we could, nevertheless, be related multiple ways. And when we share multiple DNA segments, they could be from the same Common Ancestor, or different Ancestors. In a perfect scenario, we’d each have all of our segments in Triangulated Groups, and be able to report exactly which segment (and size) went with each MRCA for the TG. Few have done that, and I’m sure the Shared cM Project (and some of my data) reflects a mix of the data. However, the large number of submissions tends to damp this out, and we wind up with a pretty good picture that links segment size and relationships. The caution is to be careful in the tails of the distribution curves… Jim
LikeLike
Another take on this…. Even though a 1C is about 880cM, over many segments, we use the full amount – because we are trying to equate the full cM to the 1C relationship. It would be exceedingly difficult to try to also figure out if one of the smaller segments actually represented a separate 6C relationship, and subtract that portion out. Way too complex a requirement for this kind of project. And even if we could do that, then if I shared 880cM with someone, I’d need to also determine if I was related two ways in order to use the tool. My head hurts thinking about this… Jim
LikeLike
Jim, thanks so much. This is a great addition to the knowledge in this area. If I can beef up my database skills I may be able to add some contributions as well. I do agree with your tighter range suggestion.
LikeLike
James, I just wanted to test my Common Ancestor Spreadsheet – I think Blaine’s Project is great, and I don’t want be in competition with him. I would encourage you to submit your data to his project. Jim
LikeLike