
A Segment-ology TIDBIT
Subtitle: Filter Your AncestryDNA Match List
Bottom Line Up Front: Filter your AncestryDNA Match list by cMs when your objective is a distant Ancestor. Also use Side and Surname filters to further reduce your Match list for review.
Most of us use the Shared cM Project to look up the Shared cMs of a DNA Match to see the possibilities of our relationship. We’ve learned that 3,500cM means a parent/child relationship; 2600 cM is a sibling; 1750cM is a small group of close relatives; 880cM is often a 1st cousin (1C), or other close relatives. And we understand that as the shared cMs get smaller, the range of possible relationships expands.
But we can use the Shared cM Project in the opposite way – what is the probable shared cM for a given relationship? We see narrower ranges for close relationships, and fairly wide ranges for more distant relationships. However, even though the range may be relatively wide for distant relationships, the average cM does shift down as the relationship gets more distant. For example, a 3C relationship would not have more than 234cM; a 7C would not share more than 57cM (and the average for a 7C is 14cM).
Suppose we are focused on a particular Ancestor in our Tree. Our Target could be a brick-wall Ancestor; or a potential NPE (Not the Parent Expected) Ancestor; or a suspicious Ancestor; a known Ancestor for whom we’d like to find a new cousin who has some in-depth knowledge of that family; etc. We can use the Shared cM Project to narrow down our search! This works for close relationships as well as distant ones – my focus here is on the distant ones, but the process is what is important.
A good site to use the Shared cM Project is at DNAPainter: https://dnapainter.com/tools/sharedcmv4 – this site provides a number of interactive tools along with the basic Shared cM chart. For example, a 5C relationship (back to a 4xG grandparent – we have 64 of them) would average 25cM – and 50% of them would be in the under-20cM range. In this case we might want to start with the 50% in the over-20cM range. But for a 6C relationship (for 128 of our Ancestors) the average is 18cM and 70% of the Matches will be in the under 20cM range. Each of us gets to pick our own objectives and projects to pursue. If yours is like many of mine and beyond the 5C range, working within a range of cMs may be helpful.
Here’s how. At AncestryDNA, open up your list of Matches, and look at the row of “Filtered by:” tabs – we can use many of these in combination.
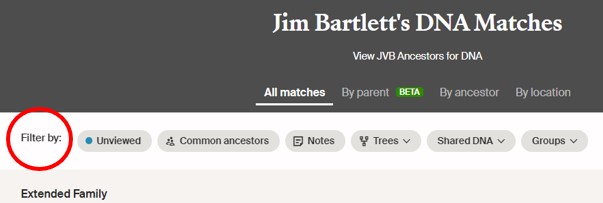
For this example I’m going to use the Shared DNA tab to select a range of cMs, AND the Groups tab to select my Maternal side.
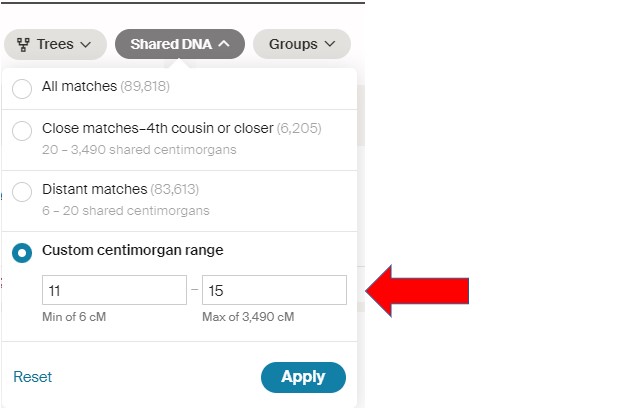
In the project I’m working on, I’ve already looked at the Matches down to 16cM. By selecting a range for the next search, I also speed up the time for AncestryDNA to produce my filtered list of DNA Matches. In this case I’ll be looking at 11cM to 15cM. Remember to Click on Apply!
I’ll also filter my list by using the Groups tab to restrict the list to only Maternal-side DNA Matches:
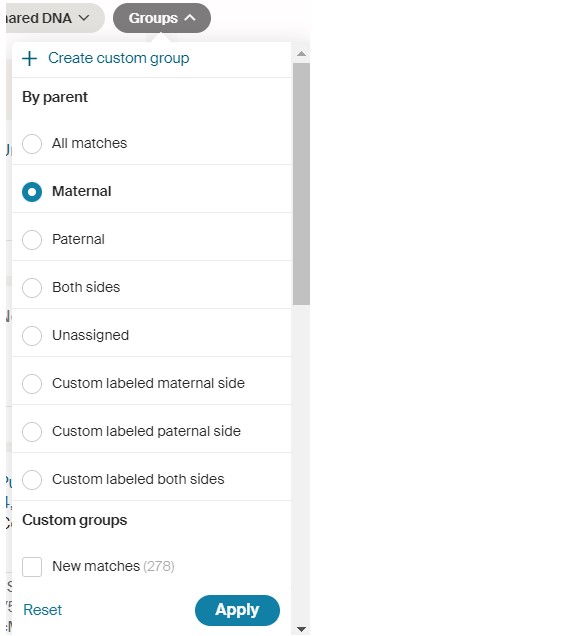
In this case, I’ve chosen the Maternal side (remember to click on Apply). This will filter out a lot of Matches that don’t really apply to my Target Ancestor [I can later select the “Unassigned” Group to check those, too.] Note that you can ALSO select several categories under Custom groups – such as New Matches (especially helpful if you want to revisit this project at a later date to check on new Matches), and/or any of your “dotted” Match categories (not much help in my current project because I’ve already visited – and dotted – all of those Matches I could determine, and I’m looking for new ones now in the under-20cM range.) In some projects, this “dotted” filter may be valuable.
And there is one more filter I often use. For my current project, I am looking for my DNA Matches who have a BROWN Ancestor. So, I click on the “Search” tab, which brings down a row of options. I type BROWN into the “Surname in matches’ trees” search box:
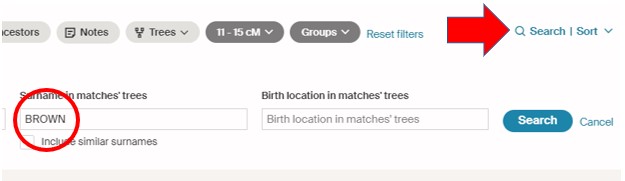
You can decide to check the “Include similar surnames” box, or not. For this project, I got plenty of results with just BROWN, and, if I wanted to, I could go back and try BROWNE or BRAUN, etc. I’ve had mixed results with the “Birth location in matches’ trees” filter box – sometimes the result is either the surname or the location, and I’d be wanting both. I did have very good results on a project with HIGGINBOTHAM surname and Amherst County, Virginia location. You might need to try some combinations to see which works the best for your project. Remember to click on the blue, highlighted Search box to include this filter.
This process of filtering is a powerful way to shorten your list of DNA Matches, tailoring them to your project goals. The addition of a cM range has helped me focus on more distant Ancestors and to speed up the AncestryDNA listing algorithm.
BOTTOM LINE: When you are searching for DNA Matches, think about the best way to combine the filters (including a cM range) and search parameters at AncestryDNA.
[22BT] Segment-ology: Using the Shared cM Project in Reverse TIDBIT by Jim Bartlett 20230601

You said “For example, a 3C relationship would not have more than 234cM” but this is confusing because
* A 3rd Cousin is a 7th Degree relationship.
* A 7th Degree relative shares as much DNA as a person would share with
their ancestor 7 generations (reproductive or division events) ago.
* 2 parents to the power of 7 generations (reproductive or division events) is
128 ancestors.
* 1 out of 128 ancestors shares 1/128 of a person’s DNA = .78% of their DNA.
* There are many relationship categories that belong to the 7th degree and the path between a person and their 7th degree relative always has 7 reproductive or division events and the category always has exactly 128 relationship path possibilities.
*This is an example of 1 of 128 possible 3rd cousin relationship paths and the reproductive or dna division events are numbered next to each relative on the relationship path between the two 3rd Cousins: 1) Father’s 2) Mother’s 3) Father’s 4) Brother’s 5) Daughter’s 6) Daughter’s 7) Son
*Ancestry’s 100% cM DNA amount is 6600, divided 1 time is 3300, divided 2 times is 1600, divided 3 times is 825, divided 4 times is 412.5, divided 5 times is 206.25, divided 6 times is 103.12, divided 7 times is 51.56
*So 3rd cousins and every other 7th degree relationship category are
anticipated to share an average anticipated amount of DNA of 51.56 cM
because the path between the two 3rd cousins involved dividing Tester 1’s
DNA a total of 7 times.
*These are ALL of the categories that belong to the 7th degree organized by the number of generations Tester 2 is older or younger than Tester 1 according to the definition of the relationship category. Note that each category has exactly specifically 128 relationship path possibilities. Also note that the only reasonably possible relationship categories will be ones where Tester 2 is no more than 3 generations older or younger than tester 1.
7 generations – 5th Great Grand Parent
6 generations – 4th Great Grand Uncle Aunt
5 generations – 1/2 3rd Great Grand Uncle Aunt
4 generations – 1st Cousin 4R (Type B Older)
3 generations – 1/2 1st Cousin 3R (Type B Older)
3 generations 2nd Tw-cousin 3R (Type B Older)
2 generations 2nd Cousin2R (Type B Older)
1 generation – 3rd Tw-Cousin 1R (Type B Older)
1 generation – 1/2 2nd Cousin1R (Type B Older)
0 generations – 3rd Cousin
-1 generation 1/2 2nd Cousin1R (Type A Younger)
-2 generations – 3rd Tw-Cousin 1R (Type A Younger)
-1 generation – 2nd Cousin2R (Type A Younger)
-3 generations – 2nd Tw-Cousin 3R (Type A Younger)
-3 generations – 1/2 1st Cousin 3R (Type A Younger)
-4 generations – 1st Cousin 4R (Type A Younger)
-5 generations – 1/2 3rd Great Grand Nephew Niece
-6 generations – 4th Great Grand Nephew Niece
– 7 generations – 5th Great Grand Child
*The mathematical range on .78% average is .59% to 1.16% and the mathematical range on 51.56% is 38.67 to 76.68.
*All relationships in that percentage range, will, if converted to a fraction result in 1/128
*1 out of 128 relatives in the 7th degree should share 2 out of 256 relatives in the more distant 8th degree if the relationship category is a whole relationship; if the exact percentage shared with a 7th degree relative converts to 1/256, then the relative in the 7th degree would be at the low end of the percentage range for the 7th degree and the exact percentage of DNA shared would indicate that the relationship category is a category within 3 generations that is not whole relationship category, but half relationship category.
*There must be 7 reproductive or division events to result in an amount within that range listed above.
*Fewer reproductive or division events result in a higher percentage of shared DNA
*More reproductive events result in sharing less DNA
————————–
So if two people share 234 cM it means that 5 reproductive or division events have occurred, two less than the 7 required on the path between 3rd cousins. For 3rd cousins to share to share 234 cM there would have to be another closer relationship in addition to 3rd cousins, so it would not be a true amount for 3rd cousins. 3rd Cousins who descend from Twins are related in the 6th degree there are 6 reproductive or division events on the path between the two testers.
Example would be Father’s Mother’s Mother’s Twin’s Son’s Son’s Son – The twin in the path is not a divsion event and so although there are 7 ‘steps’ there are only 6 times that the DNA of the tester is divided. The result would be a maximum of 154.03, an average of 103 cm and a minimum of 77.34.
—————————
My understanding is based in part on the Ancestry white paper that discusses meiosis or reproductive events. Since they don’t discuss the dna division that occurs with a half sibling and it is not really another reproductive event I just threw it in in my explanation. The white paper does not, that I recall, explain why they give the correct categories for the correct degree of relationship but label the match as 5th to 8th cousins when they don’t even detect centimorgans for categories that distant. The shared cM project collected known results for various relationship categories and most are probably in range but many were likely not in range due to the submitter being incorrect about the facts of how they are related to the other person.
I was so confused by 3rd party tools saying things like the average shared DNA for a 7th cousin is 14 cm that I had to sit down and do all the math and calculations for 51 degrees of relatedness to figure out what was going on and that the word “average” is being used by 3rd party tools in a very confusing way. The average of all known reported results for 7th cousin might be 14 cm, but it is not the actual average amount of DNA shared by 7th cousins. I wish they’d show their math.
Here is the math: a 7th cousin is a 15th degree relative because there are 15 reproductive or division events between testers who are 7th cousins. They share about the same amount of DNA as they would with an ancestor 15 generations older than them. 2 parents to the power of 15 generations is 32768 15th generation ancestors – so 7th cousins share as much DNA as you would with 1 out of 32768 15th generation ancestors. 1/32768 = .00305% shared DNA average with a 7th cousin. .00305% * 6600 cM (Ancestry’s Max cM) is Point .20 cM and a range of .15 to .25. If two people share 14 cM they are in the 9th degree and if they are the same generation they are 4th cousins. The difference between 4th cousins and 7th cousins is 5 reproduction or division events – they are not even remotely close to one another. It is so frustrating that 3rd party tools seem to default to ‘predicting’ that the most likely relationship category is 5 full degrees more distant than the centimorgans actually indicate. The only answer I’ve been given when I inquire in the facebook groups is that there are more 7th cousins than there are 4th cousins….but it is as if the percentages of shared DNA that actually belong to the relationship categories are totally disregarded after 3rd cousin. Ancestry labels 4th cousin matches as 5-8th cousins but when you open up the match it actually lists 4th cousin as the most likely relationship category as they should. I have always been able to find the connection where it is supposed to be in alignment with the cM except when the relationship was a twin descendant and now that I made myself a list of all the categories and percentages for twin descendants, I won’t be tripped up by that anymore. The % shared lines up perfectly with the number of times the tester’s dna gets divided along the path to the person they match with. It is not possible to divide 6600 cM 15 times and come up with 14 cM. Something somewhere along the line is skidgywampus. There are more 7th cousin relationships possible than there are 4th cousin relationships possible that part is true, 32768 compared to only 512 – but those relationships are on paths that are unique and specific to 8th cousins. We are not pulling cousin types out of a bucket where the fact that there is more of a particular type means that the match is more likely to be related in the category with “more” – we are ascertaining the correct relationship category based on the amount of DNA shared and other factors like age or in some cases shared segments. Maybe you can provide a better explanation than I’ve been able to get in the facebook groups as to why the 3rd party tools start estimating crazy distant relationships after 3rd cousin.
LikeLike
Marilynn – There are several ways to look at this analysis. In general we get exactly 1/2 of our parent’s atDNA. One way to go beyond our parents is to just keep dividing by 2. But the DNA is random. Our parent’s don’t pass exactly 1/2 of their parent’s atDNA to us. Sometimes they pass a whole chromosome from one of their parents. So on that chromosome, we get 100% from one grandparent and 0% from the other grandparent. It *tends* to balance out over all 44 atDNA chromosomes, but it won’t be exactly 1/2. By the time we get back 7-9 generations, some of our Ancestors actually drop off as contributers to our DNA. So rather than using the mathematical fractions, we use emperical data. Each relationship has a range of possibilities – we see a distribution curve. Blaine Bettinger has collected input from many folks and created the Shared cM Project which shows the average, mean, and distribution range of values we see in actual practice. It turns out that 234cM is maximum that has been reported for a 3C relationship – but I’m sure someone will, someday, find a larger value. The point of the post is to be generally aware of the values seen in practice, and if you fall outside of those (or even near the extremes), you should look harder at your conclusions. Hope this helps, Jim
LikeLike
My mom’s neurologist once told me that my mom had Parkinson’s and Alzheimer’s. I said what tests did you run? How do you know? He said empiricle knowledge I said what does that mean? He said it means my experience. I told him I bet his hunch was cheaper than running tests. She was over medicated and had an infection and her mind cleared up ultimately. So Blaine’s shared cM project is great but we need a much clearer line drawn between the real percentage of dna share with its very real range and what would be considered max or average based in the results of his survey! I was so frustrated with the fact the math does not make any sense at all with some 3rd parry tools basing predictions on theoretical possibilities of numbers of children I could not get a straight answer on what the real range was except when I dug into the ancestry white paper that does not include all the conjecture or known results. I think studying the known results is important to see what might trigger numbers to diverge from the true range on the average. But the predictions are being itaken to be the actual range by lots of people and it clouds where people should start their research. It sure did for me wasting time on ranked predictions – when I learned how to get to the real range and that the percent of shared dna is the result of dividing the dna a certain number of times everything became clearer. I start with the assumption that the test is accurate and I attempt to find the connection in the degree associated with the shared percentage in a catagoy that reflects my educated guess on generational desperation of the testers and which tester is older. If I can’t make the connection where the science would expect it I ajust my guess about generation and see if I can make the connection there where it is expected. I don’t start looking in degrees where my centimorgans are not expected or in generations way out of alignment with the obvious until I’ve failed to connect where the test indicates the connection would be. 234 is the highest value reported but it’s way out in left field and the only basis for saying that it is the high end of of the reported results DNA painter should put big caveats and stars on information that diverges from the real average. I love DNA painters tools but the line between fact about the relationship category and probability based on a host of other factors is too fuzzy I appreciate your reply though than you
LikeLike
Marilynn – I am sure you are familiar with the concept of a normal distribution curve. One version of the data may result in a tall/skinny curve, with most of the values close to the average. Another version of the data may result in a short/wide curve, with many of the values spread out from the average. With cM data, a parent/child relationship will be tall/skinny; but as we move to 1C, then 2C, and further out in relationships, the distribution of real values gets shorter and wider – more and more of the actual shared cM amounts deviate from the average (in both directions).
I don’t know how many Common Ancestors you have determined with your DNA Matches. I’ve been at this for over 10 years and have documented over 8,000. In any case, you can run a little experiment with your own experience…. Select a relationship – say the 4C example I used (the calculated value is about 14cM), and see what the distribution is for the shared cM of all the 4C relationships you have determined. I agree with you that it would be very unlikely to include one at 234cM. The point is to see – with your own data – what the spread is. Jim
P.S. On a lark, I just sorted my Common Ancestor Spreadsheet on the cousin column – I have 118 Matches at exactly 4C relationship; the average is 22cM and the range is 6cM to 48cM. FWIW
LikeLike
But also in those situations where we don’t inherit from 1 grand parent as much as from the other we are still related to their relatives and for the grandmother to share double and the grandfather share nothing would be an anomaly worth studying and being aware of but it’s not how it was designed to work we have to assume we will have normal results until we prove otherwise right otherwise we’d be chasing down hundreds of very unlikely categories which I did in the past
LikeLike
When we do chromosome mapping by generation we typically see a slight deviation at the grandparent level – say like 24 & 26% on one side and 27 & 23% on the other side. Rarely 25.000 / 25.000. And note that the two percentages on one side add up to 50% each. At the next generation we might see: 11/13 (adding up to 24), 23.5/22.5; 12/15; and 12/11 [the total is always 100.0]; etc for each succeeding generation – each generation is confined to the totals in the next closer generation. After a while some Ancestors drop out – see my blog post on the Porcupine chart. In general the Ancestors start to drop off about at a genealogy horizon (not a hard line, but approximately). Thus we don’t usually see this in genetic genealogy, unless we are really pushing the limits of atDNA.
And to the point of a whole grandparent chromosome being passed intact (and the other grandparent contributing 0 for that chromsome), this is not unusual. One average this happens on at least one chromosome (out of 44) for each of us. It is expected to occur.
This is based on a the large body of scientific evidence – I’m just reporting it, the best I can.
Jim
LikeLike
Thank you so much!! I needed this information.
LikeLike
Karen – Great! Thanks for your feedback. Jim
LikeLike
Pingback: Too Many Tabs Tuesday - Hound on the Hunt
Thank you for this useful tip. I am still working through a tip you shared recently for using Ahnentafel numbering for my matches. Which brings me to a question for you. Do you know how AncestryDNA does its predictions for Common Ancestor? MANY of my matches do NOT have trees, yet Ancestry has predicted a CA. I am wondering how reliable these predictions are. (Do they have an AI building out trees?)
LikeLike
Barb – the rumor is that Ancestry has a very large 1-Tree, of sorts. When you search for a particular Ancestor, Ancestry can almost instantly list, say, 256 Trees with your Ancestor (or very close, which is often a good thing). They already had that person tagged. They list the ones with the most sources/records first, but you can scroll through the whole list. It might be like AI “collecting” trees, because many of them are not built out. But if you search on what appears to be a dead end Ancestor in someones Tree, they can usually find many Trees with at least the parents. I’m suspicious when there are only a few Trees, or when there are a lot of versions of the parents – it’s a judgment call. Ancestry also uses this (AI if you will) system to develop ThruLines. Having reviewed through thousands of ThruLines and compared to my genealogy developed over the past 48 years, I estimate that Ancestry ThruLines are correct over 95% of the time (my Ancestry is mostly Colonial Virginia). In general, it appears Ancestry does NOT do research (check with bmd or census records), so sometimes if someone makes a bad guess, and many others copy it, Ancestry will go with the flow and report it. I have several of those, and it IS hard to turn that tsunami around. On the other hand, I like the 95% that are done for me. Another thing is that Ancestry can “see” the private but searchable people, and their ThruLines will report those relatives. ThruLines does NOT look into UnLinked Trees as some of them are not for the Match. I’ve seem them link to Private Trees; I’ve not seen any linked to NO Tree at all. Hope this helps, Jim
LikeLiked by 1 person
Thank you for the insight, it gives me more confidence in the predictions. I am down to the 17cM shared level for my Ahnentafel project. Using the ‘View Relationship’ link on these matches also provides a higher level of confidence in the predicted CA. I have been leaning heavily on that for matches with small trees. BTW, I checked for matches named ‘Bartlett’, I have 7 but no Jim. I was hoping to tap into your 48 years of research… Thanks again for all the tips.
LikeLike