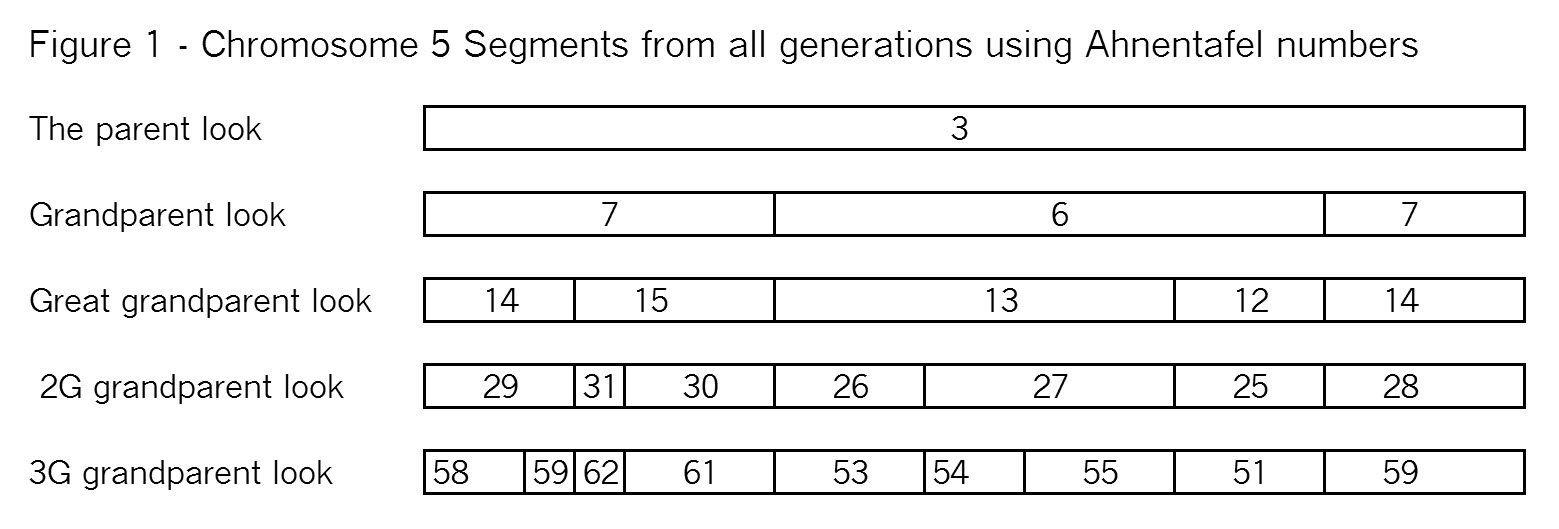
In blog post Segments: Bottom-Up we looked at ancestral segments from the bottom up. That is we started with you and the very large segments (aka chromosomes) you got from each parent. Then we continued with two crossovers per generation to the 3G grandparent level. Of course, this is not the way DNA works! DNA comes from our ancestors to us – Top Down. So let’s see if we can reconstruct the segments we had in Figure 6 of Segments: Bottom Up. Here is that Figure again as Figure 1:

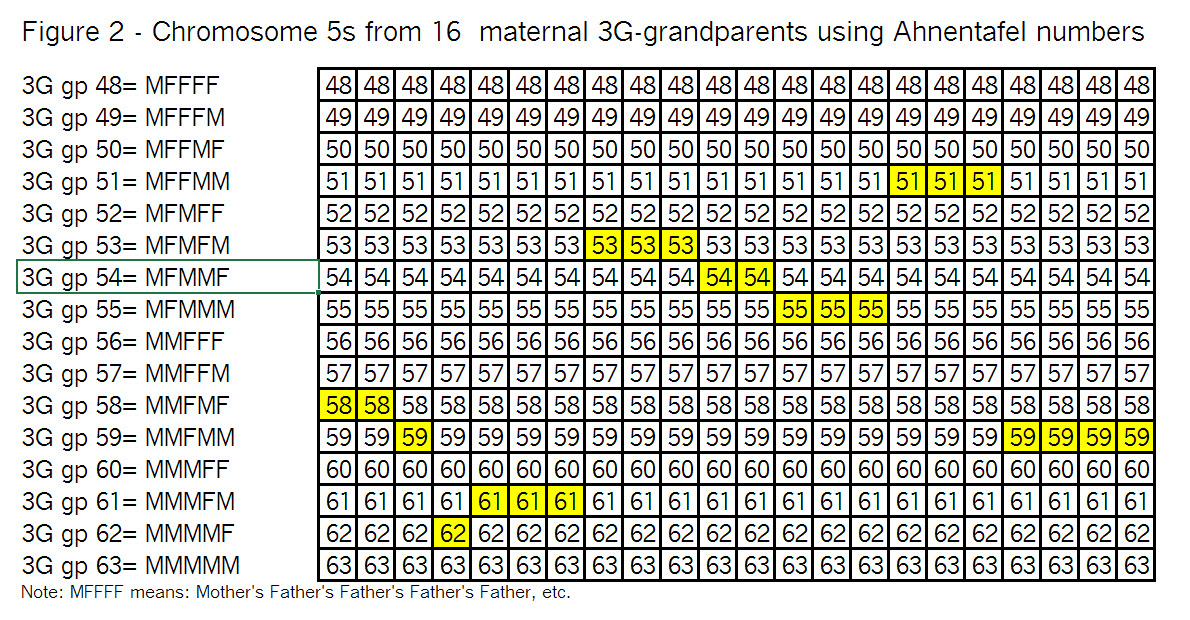
To do that, we have to start with the chromosomes of the 16 3G-grandparents; and take them Top-Down a pair at a time. Ready…? Here we go – Figure 2:
Observations from Figure 2:
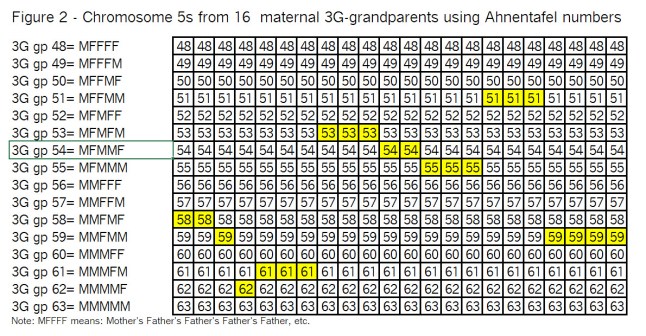
I’ve highlighted the segments (in yellow) that we wound up with in Figure 1, just so you (and I ;>j) can keep track of them as we go through the recombination process.
Note that with only 2 crossovers per generation, there are not a lot of subdivided segments.
In the left-hand area, “3G gp” is Great, Great, Great grandparent; the numbers 48 to 63 are Ahnentafel numbers; and M means mother; F means father.
So the next step is recombination of each pair of parents, as show below. This mean 2 crossovers for each pair (noted by the vertical lines, and flipping the 2 chromosomes after each crossover. Then one of these 2 chromosomes is not used (noted by the X). See Figure 3:
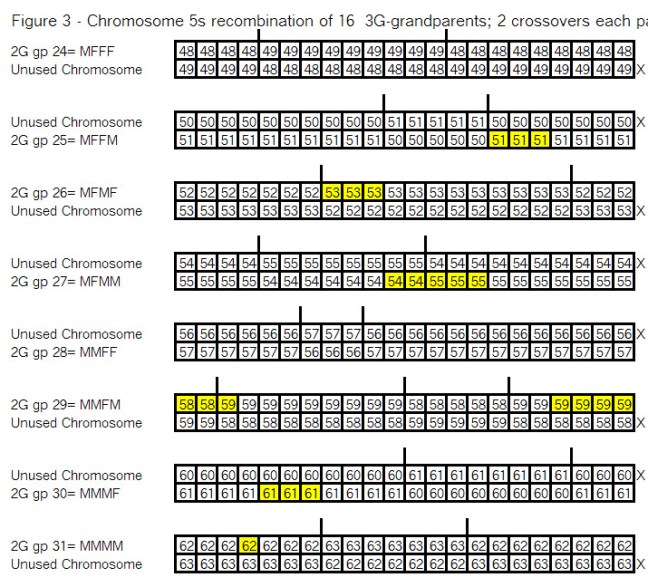
Observations from Figure 3:
The highlighted segments are all in the chromosome which gets passed on to the child.
Note that at each generation, the highlighted areas “cover” the whole chromosome.
One of the two chromosomes is X’d as it is not passed to the child.
The remaining chromosome in each pair is passed to the child
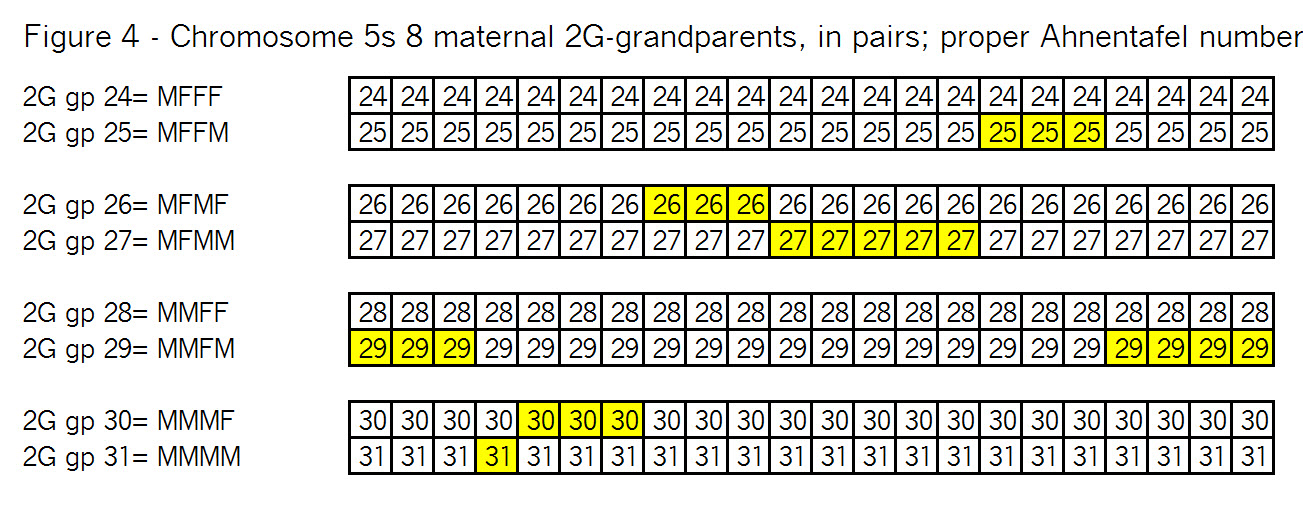
The child is noted by an Ahnentafel number which is half – e.g. 28 is the child of 56 and 57.
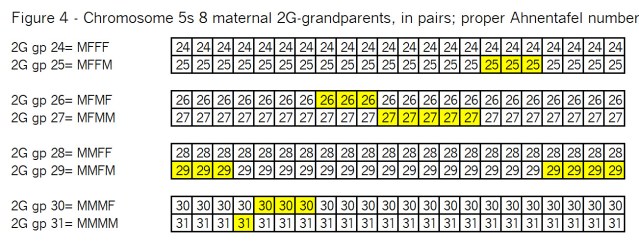
Let’s see how this looks with the remaining ancestors in pairs in Figure 4:
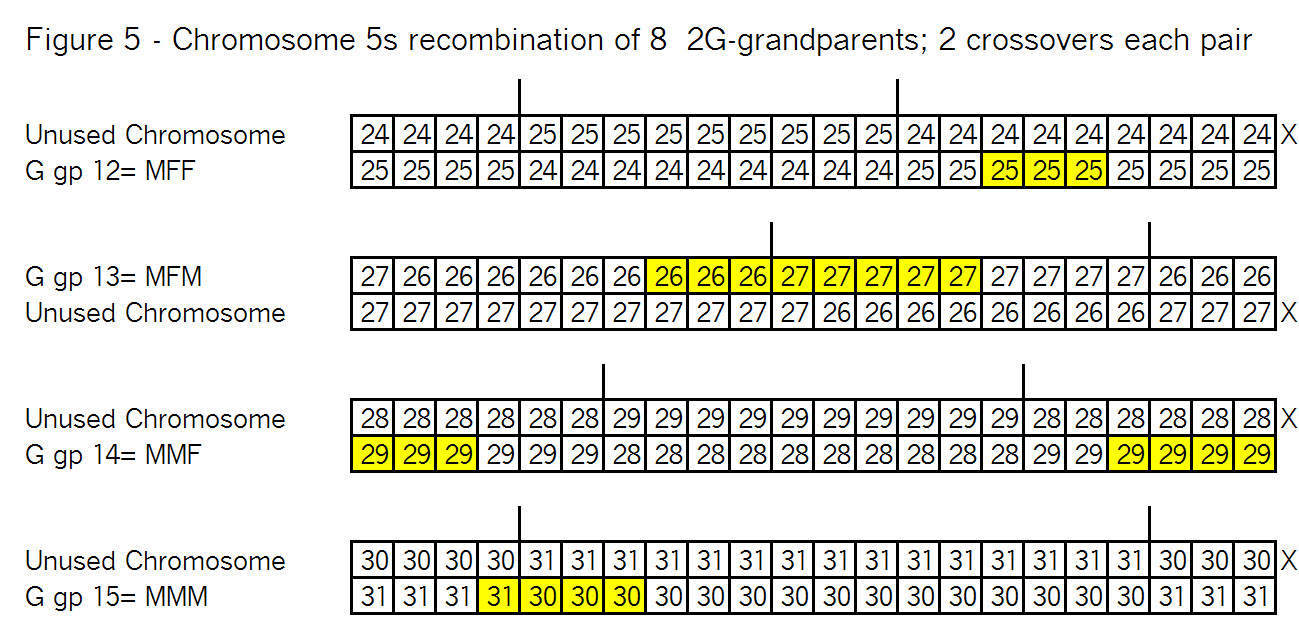
As before these pairs of chromosomes are recombined at the crossover points as shown in Figure 5:
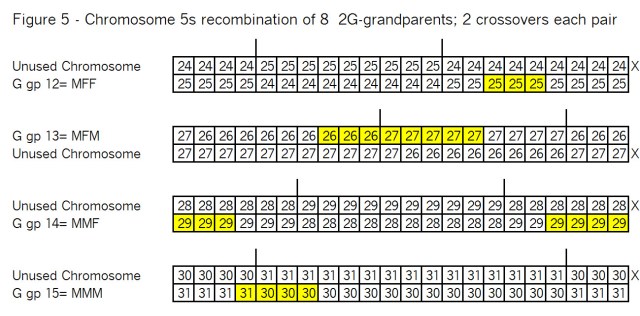
Observations from Figure 5:
Same as observations from Figure 3.
Compare these segments (Ahnentafel numbers and locations) with Figure 1.
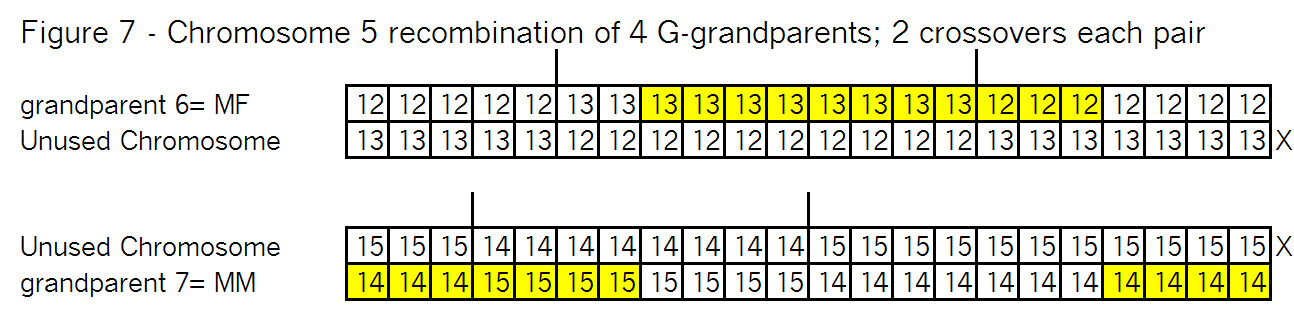
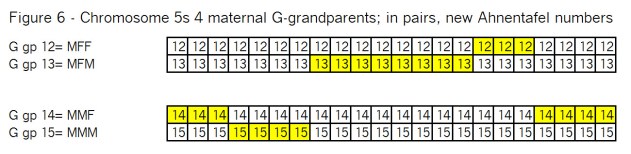
Let’s see how this looks with the remaining 4 G-grandparents, arranged in pairs in Figure 6:
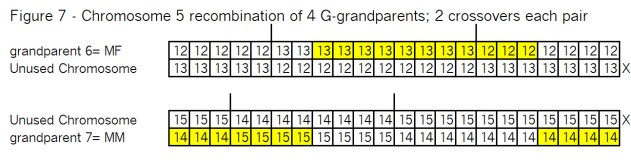
As before these pairs of chromosomes are recombined at the crossover points as shown in Figure 7:
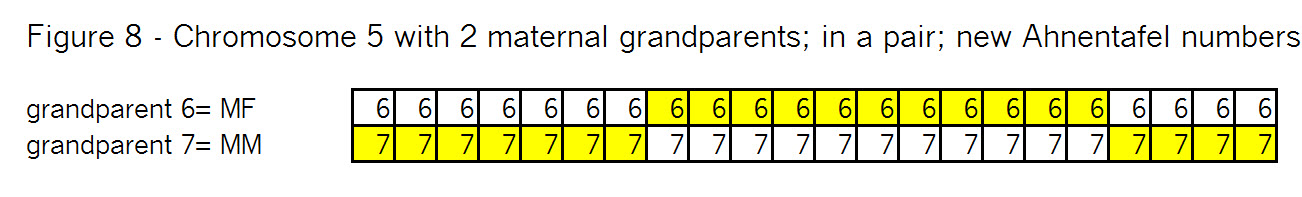
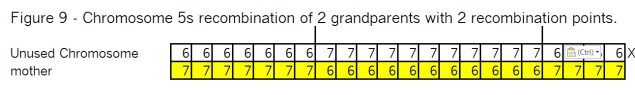
Grouping these two remaining maternal grandparent chromosomes in the mother, for recombination seems very familiar from the Segments: Bottom Up blog post. Let’s see in Figure 8:

See if you can determine where the 2 recombination points have to be, in order to wind up with the same results we show in Figure 1 – which was the final result of a Bottom-Up look. Here is Figure 9:
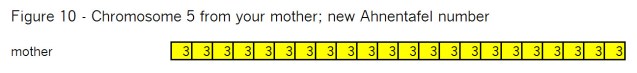
Finally we have the chromosome from your mother in Figure 10:
Final Observations:
A comparison with Figure 1 shows the same outcome with a Bottom Up review.
There were many of the “random” recombination points above which could have been different because, in the end, that portion of the DNA was not passed down.
But certain recombination points had to be where I selected them (not at random), because I was working toward a known chromosome map – the one we came up with in the Bottom-Up review. If I had been truly random in the Top-Down analysis, I could go back and recreate the same answer using Bottom-Up. The point is that you can arrive at the same answer using a Bottom-Up or a Top-Down analysis.
Your DNA already has all of these recombination points in it. Triangulated Groups will help you define these points.
For you, each recombination point has already been determined, some at one generation and some at another. How to determine which generation it is will be a separate blog post… (when I figure it out ;>j – think MRCA with each Match…)
Remember there are about 70 recombination points created across all of your chromosomes in one generation – usually a few more from your mother’s side, compared to your father, but it’s an average, and DNA is random.
Note that your recombination points will not be the same as your Match’s recombination points – your Match almost certainly did not get the same ancestral segment you did (re-read What is a Segment? for the difference between ancestral segments and shared segments). This is one of the key reasons why spreadsheets (with shared segments) for different people should be kept separate. Although you may have a shared segment with a Match, there is no correlation between your ancestral segments/crossover points and your Match’s.
We can see above, the generation where a particular ancestor’s DNA is no longer included. We noted this in the Bottom-Up post as well. Although that ancestor is no longer on this chromosome, he/she could well be on a different chromosome.
Note that the ancestors whose DNA is no longer included on your chromosome, is not the result of segments being subdivided into oblivion (or even small segments that don’t show up as a match). Ancestors dropped out of the picture largely because their DNA was on the chromosome that was not used. At every generation, half of the DNA involved is not used! It’s no wonder, some ancestors drop out. Again, we are not talking about little pieces of DNA, but large chunks in many cases.
You are encouraged to take pencil and paper (or a spreadsheet), and try variations on crossover points and recombination. Play with crossover points at various locations. Put them close together in one generation to create a very small ancestral segment. Or try dividing segments in half with each generation (averaging, say, 2 crossovers per generation) and see how many generations there are before all the segments are below a threshold (say 7cM). I think you’d be surprised at how many generations back you can go. And if you unbalance the process (not cutting each segment in half (50/50), but say 25/75, or even 10/90), you will get even more generations with above threshold segments.
Have fun with it.
05B Segmentology – Segments: Top-Down by Jim Bartlett 20150601