Genetic Ancestors – the Porcupine Chart
First let me define Genetic Ancestors. These are the ancestors who passed DNA down to you. Your DNA includes some DNA from each genetic ancestor. But, as we’ll see, not all of your ancestors contributed to your DNA. Some of your distant ancestors passed DNA down to their descendants, but that DNA never made it all the way to you. So let’s delve a little more into this concept, so you’ll know what to expect as you form Triangulated Groups, work with your Matches to find Common Ancestors, and fill out your chromosome map.
You get exactly 1/2 of your autosomal DNA (chromosomes 1-22) from each parent. Each parent has used the two chromosomes they got from their parents (your grandparents) to create one chromosome for you. Actually this is the fundamental way DNA is passed down to you and to each of your ancestors so let’s take a closer look at this process in Figure 1.

Here are some important points about Figure 1:
- The parent has two of each chromosome – one from each of his/her parents (the child’s grandparents)
- The parent takes part of each of the two chromosomes and makes a new chromosome (this process is called recombination)
- The parent then passes this new chromosome to a child
- Clearly, there is a wide range of alternative possibilities for the new chromosome – I’ve shown 3 alternatives: one where the new chromosome is roughly a 50/50 split between the grandparents; one with a larger split; and one where there is no split (no recombination), and the child gets all the DNA in this chromosome from one grandparent. All of these possibilities occur in nature. And in fact the odds are that one of your smaller chromosomes (18-22) is probably all from one grandparent.
- Note that the child got one chromosome from the parent who started with two chromosomes – the child got exactly 1/2 of the DNA from the parent.
- This figure shows the total amount of DNA in the new chromosome, not necessarily how it is split up into segments. For more on segments read: Segments: Bottom-up
- This figure is based on one chromosome for the child. The recombination process happens for all of the 22 chromosomes, for each of the two parents.
So, since you got exactly 1/2 of your atDNA from each parent, and they each got exactly 1/2 of their atDNA from their parent’s, wouldn’t you be getting exactly 1/4 of your DNA from each grandparent? Well… no! As shown in Figure 1, the child could get any mix of DNA from the grandparents – just as long as it added up to 100%. On individual chromosomes the mix can vary quite wildly, but in the aggregate over all 22 chromosomes, the average tends toward 50/50, but with a range of possibilities. However, in each case the two percentages will add up to 100%.
Also you can re-read: Measuring Segments to see that you can measure and total the two grandparents’ segments by base pairs (bp), centiMorgans (cM) or SNPs – you’ll get the same percentages and totals with any method.
So let’s continue this story by looking back one more generation – to the contribution by the great grandparents. Let’s continue to look at one chromosome and assume the mix from the grandparents is 45/55. To keep the description brief and the graphics clear, we’ll look at the 55% from the grandmother. Just like the standard process in Figure 1, this 55% portion will be composed of contributions from the two great grandparents. The great grandparent mix over this portion could range from 50/50 to 0/100, and the two numbers will always total 100. These two great grandparents cannot contribute to the 45% area (two other great grandparents do that), so their total contribution will only be of the 55% portion. So let’s say their mix is 60/40. So over this chromosome, these two great grandparents contributed 33% and 22% (for a 55% total). Note that the 60/40 split is wider than the 45/55 split. This actually happens in nature – the split’s tend to get wider [or wilder, or more random, or have more deviation more from the average] the farther back you go.
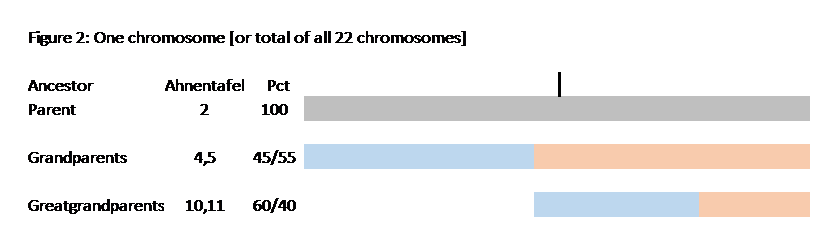
It’s time for another visual depiction – see Figure 2:

Important points from Figure 2:
- You see the total chromosome (100%) the child got from one parent. [The vertical black “tic” is at 50%]
- Under that is the 45/55 split between grandparents.
- The third row shows the 55% contribution of the parent’s grandmother, being split between her parents, by 60/40. Think of blue as the paternal side, and pink as the maternal side in each succeeding generation. I don’t show the other grandparents – it gets too messy. I just want to follow some ancestral path back, to show how the genetic (DNA) contribution of some ancestors gets smaller.
- Note that although this is shown for one chromosome, the same principle applies to the aggregate for all chromosomes.
- Note the use of Ahnentafel numbers to easily keep track of the ancestors.
So, let’s carry this story further back in Figure 3:

Important points in Figure 3:
- You see the diminishing amounts of DNA that are passed down by more distant ancestors.
- In the last two lines (4G and 5G grandparents) you see the percent of each couple still totals 100% (of that portion on this chromosome), but the farther back you go (down the chart) the split between the ancestral couple tends to get wider.
- In fact, for the 5G grandparents, one of them drops out altogether. That 5G grandparent that dropped out (#172) probably contributed to all of the other generations down to and including your parent, but when your parent recombined his parent’s DNA, it just didn’t include any of the small contributions from this particular 5G grandparent.
- On a chromosome level, this 5G grandparent (#172), may not have contributed to other chromosomes either. Once an ancestor drops out of all chromosomes, their contribution to you becomes 0, and this ancestor is then not a genetic ancestor!
- Re-read: Segments: Top-Down to see how the DNA of some ancestors drop out of the mix.
- Also note that this 5G grandparent (#172) probably did contribute some DNA to many of his other 5G grandchildren, just not to you.
As we look farther up the ancestral Tree, we find more and more ancestors drop out of the mix – you don’t have any DNA from them.
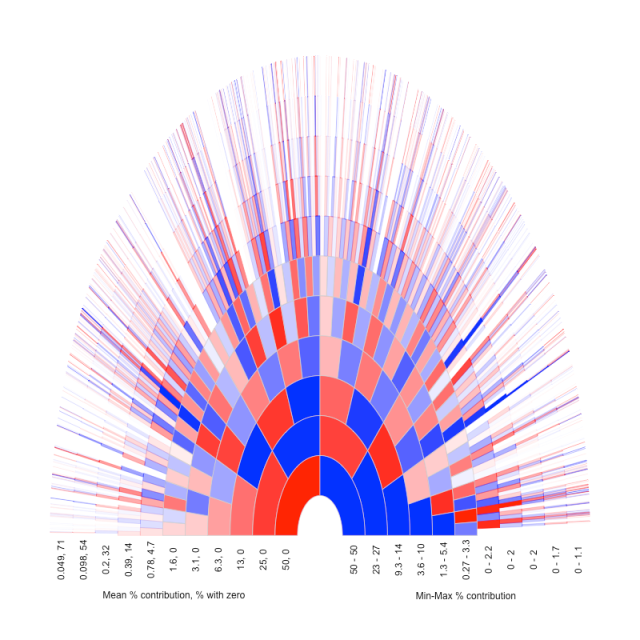
Another important point in this genetic ancestor analysis is that at each generation, going back, at least one ancestor in each couple has to be there to pass the DNA down. Another way to put this is that one parent in a generation may drop out of the DNA mix, but the other one cannot. One of the two of them had to pass down the DNA that the child (your ancestor) got and passed along, eventually reaching you. And that distant ancestor (who passed down the DNA) had to get that DNA from at least one of their parents. Theoretically, your DNA goes all the way back to DNA Adam and Eve. In a more practical timeframe, as in your genealogy, there will be genetic ancestors at each generation who contributed to your total DNA. This is true whether you have identified them in your ancestral Tree, or they are behind a brick wall – whether they are known to you, or not. At each and every generation, you will have genetic ancestors whose DNA contribution to you will add up to 100%. But not every ancestor will contribute – only the genetic ancestors will… This leads us to what I call the Porcupine Chart in Figure 4.
Figure 4: The Porcupine Chart:

Used by Permission
This wonderful chart was developed by The Coop Lab – see http://gcbias.org/2013/11/11/how-does-your-number-of-genetic-ancestors-grow-back-over-time/ for their article and another chart of genealogical and genetic ancestors vs generations. It shows a standard ancestral fan chart, colored in with only genetic ancestors, moving out from you at the center. Figure 4 is an approximation based on simulations. It is not “the” chart for everyone. Your results will vary, just as your random DNA, and the contribution by your ancestors, will vary. This chart is intended to illustrate several key points:
- Most of your closer ancestors contribute to your DNA.
- At some point a few ancestors drop out of the mix.
- When an ancestor drops out, his/her spouse/mate stays in the mix.
- Every ancestor who has contributed to your DNA has a porcupine “quill”.
- The “quills” extend forever – there is always another ancestor who passed down the DNA (theoretically back to DNA Adam and Eve, but in a practical sense, back farther than you can go on your genealogy).
- Although ancestors who contribute DNA to you continue to drop out with each succeeding generation going back, the number of contributing ancestors at each generation going back cannot get smaller. NB: some of the individuals may repeat as multiple ancestors, but the number of positions for ancestors in the Tree who contribute to your DNA never gets smaller. In the extreme, the number of genetic individuals gets very small at bottlenecks and deep ancestry; but the number of “slots” in the Tree is very great.
- In a practical sense – in your genealogy timeframe – there will be a growing number of ancestors who contributed to your DNA in each generation [each will have a different Ahnentafel number]; and some of them will be repeat ancestors [one individual ancestor may have multiple Ahnentafel numbers].
Above-threshold segments:
Generally, the closer genetic ancestors will contribute a lot to your DNA, and more distant genetic ancestors will pass down a smaller contribution to your DNA. But a genetic ancestor will always contribute something. We can divide our genetic ancestors into two groups: those who pass down “above-threshold” segments, and those who pass down smaller segments. When all the DNA from a genetic ancestor falls below the threshold value, you won’t see any cousins from this ancestor on your Match list. This is a limitation of our programs today. This is what has happens when a true 3rd cousin doesn’t show up as a Match. You and the 3rd cousin probably share some DNA from a common 2x great grandparent, but not enough to meet the matching criteria. However, if you compare yourself with this 3rd cousin at GEDmatch, and lower the threshold to 300 SNPs and 3cM, you will usually find matching IBD segments. Also, by testing and comparing siblings and other close relatives with this 3rd cousin, you may well find that they have above-threshold segments and match. The point is that some genetic ancestors may be above-threshold ancestors with you, and not others; and vice versa.
OK – we’ve now seen that you have many ancestors, but only some of them are genetic ancestors. And only some of your genetic ancestors will pass down above-threshold segments to you.
The most important group of ancestors to genetic genealogists is a subset of your genetic ancestors – it’s those genetic ancestors who passed down to you, and a Match, at least one DNA segment which is over the threshold amount.
So there is another chart which is based on ancestors who contributed DNA segments over the threshold amounts. The chart will be of a similar form to Figure 4, but the missing ancestors will occur closer to you, and the quills will be truncated when the segments get too small (the quills don’t go back forever). The chart will look like a skinnier porcupine with a crewcut – stop to visualize this…. These are the Common Ancestors we are looking for – this is the portion of our genealogy and our ancestry that we are working with. And, yes, some (many?) of these Common Ancestors will be beyond our known ancestral Trees. Someday… much of this chart will be drawn from our completed chromosome maps.
From my experience, it appears that the number of ancestors who contribute above-threshold DNA segments will usually include all of our 16 2G grandparents, maybe all of our 32 3G grandparents, and most of our 64 4G grandparents (5th cousin level). I think that most of our Matches are in the 6th to 8th cousin level (where some of our 7G grandparents have passed “sticky” segments down to us); and that it drops off after that, with some Matches out to 10-12th cousin level with a few of our more distant grandparents. That would be what the skinny porcupine with a crewcut would look like.
A final note: the ancestors we “see” through matching algorithms may be only part of the genetic ancestors who contribute above-threshold DNA to us. We can only compare with Matches who have taken an atDNA test. Some of our ancestors may have very few descendants, or be from an area or country where few folks take DNA tests. So the fact that we don’t find Matches to some ancestors, doesn’t necessarily mean they didn’t pass down sufficient DNA. I’ll have to explore this more, in a different blog post. Chromosome mapping will also help resolve this.
Summary Observations:
- Our genealogy ancestors fill up every slot in every generation of our ancestry Tree – doubling with each generation [each with a different Ahnentafel number] – forever.
- Individuals will repeat as ancestors [each may have multiple Ahnentafel numbers]
- Our genetic ancestors begin to drop out of our Tree at some point.
- Our genetic ancestors who have passed down above-threshold DNA segments begin to drop out of our Tree even sooner.
- At each and every generation, there are genetic ancestors whose DNA contributions total 100% – for all of our atDNA and for each chromosome.
- The number of genetic ancestors will increase with each generation. And like genealogy ancestors, individual genetic ancestors can also repeat.
- Each genetic ancestor will have an ancestral “quill” of genetic ancestors.
- Only genetic ancestors who pass down enough above-threshold DNA will be seen as Common Ancestors between Matches
- The number of above-threshold genetic ancestors will increase for perhaps 7-9 generations, and then decrease for the remaining generations.
- The above-threshold genetic ancestor chart will look like a skinny porcupine with a crew cut. The crew cut “quills” will include “sticky” segments which survive for several generations.
- A porcupine “quill” is not necessarily just one segment. The “quills” are for ancestors, and an ancestor may pass down multiple segments.
- At each generation, and on each chromosome, the DNA from a parent will be from some mix from his/her parents – ranging from an even 50/50 split to an all or nothing 0/100 split.
07A Segment-ology: Genetic Ancestors – the Porcupine Chart by Jim Bartlett 20150806