
Endogamy PART I – Shared DNA
This blogpost looks at the amount of shared DNA from endogamy. It does not address the genealogy of endogamy, but instead establishes some terminology and reference material.
First let’s define endogamy: the custom of marrying within the limits of a local community, clan or tribe [Oxford Dictionaries online].
This means cousins marry each other; and those two cousins have at least one ancestor who is the same. In others words an ancestor is in our tree more than once. The same individual occupies two (or more) blocks (or positions) in our tree, and their respective descendants (cousins) marry each other.
Classic examples of endogamous populations include Ashkenazi Jews and Low German Mennonites. In genealogy, endogamy is also used to describe multiple cousin marriages in limited population area such as those found in various areas of Colonial America, for instance [c.f. ISOGG wiki].
Let’s take a more in depth look at how DNA is passed down, how much DNA is shared between cousins, and examine the impact of endogamy. How does endogamy affect the total amount of DNA shared between cousins and the size of the shared segments?
Ground Rules
Use average cMs. DNA is very random and there is a wide range of possible values of segment cMs passed down from ancestors, as well as the amount of shared cMs between cousins. For this article, I will consistently use the calculated average values. In practice we see values above and below these average values, but with large data they should average out to the calculated values. By using the average cMs we should all come to the same results.
Use 7040cM as the total cMs in one person. Each company tracks the cMs a little differently. I picked this value because it’s roughly right*, it divides easily, and it compliments my notional Segment Size Chart here. We want to stay focused on the big picture and keep things in good perspective, rather than get into a debate about which company has the best total. I’ll use 7040 as the “base”, and also show the percentage that is passed down and shared. You can use a different base if you want. It’s the relative values we are after here, so it really doesn’t make much difference which base you use. The takeaway should be a general understanding of the effects of endogamy.
Use A to designate an ancestors who is in a pedigree more than once. A1 and A2 would be the same individual (A) in two different positions in a pedigree.
Use one Ancestor (A). We usually note a couple as the Common Ancestor because we don’t know which one passed the shared DNA segment down to you and your Match. But only one Ancestor of this couple had that DNA, and I use only one Ancestor is this analysis.
Base Chart [E1]
For this discussion we will use average values, and each descendant will get exactly half of their parent’s DNA. Also the shared amount decreases by a factor of 4 with each generation. This gives us the following Base Chart:
Explanation of Figure 1:
Values under You and Match are in cM. 4C means 4th Cousin; and 4C1R means 4th Cousin once removed. This will be similar in other figures.
Column 1 shows a Common Ancestor (A) at the top of the chart (with a total of 7040cM of DNA). The list of descendants is noted by Gen 1, Gen 2, etc. Note with atDNA, the descendants could be male or female.
Column 2 shows the total amount of DNA passed down from the Common Ancestor (A) to the descendants in each Gen. For the purposes of this article, I used one half of the ancestor’s DNA in each succeeding descendant. Usually this column represents you.
Column 3 shows the relationship between the descendants on your line vs. the descendants of a Match’s line in Column 4.
Column 4 shows the total amount of DNA passed down from the same Common Ancestor (A) to the descendants in each Gen. Again, I used one half of that ancestor’s DNA in each succeeding descendant. Usually this column represents your Match.
Column 5 shows the total amount of DNA that would be shared between you and your Match at each generation. Note that the amount decreases by a factor of 4 in each generation. [Sidenote:In the case of a half cousin, the amount of shared DNA is halved. Example 4C = 13.75cM shared; 4C1R = 6.875cM shared; 5C = 3.438cM shared.] Note that in Gen 6 (5C level) the share is 3.44cM, which is well below a matching threshold of 7cM. Clearly the average 5C would not show up as a Match. However, we know we have many 5C Matches above 7cM, so those Matches which are reported are well into the upper “tail” of the 5C distribution curve – see cM notional distribution curves here.
Column 6 shows these shared cMs as a percentage of the base [7040cM]
Column 7 is a little trick – it shows years inversely spaced at 30 year intervals, starting with a genealogist born about 1950. This allows you to either 1) look at a year of interest to you and see the probable cousins you’d have with ancestors of that time period, or 2) look at the cousinship of a Match and see approximately when the Common Ancestor lived. Of course it’s a very rough approximation, AND you should feel free to use different years that roughly work with your pedigree. This one works pretty well for me…
Column 8 is another little trick – it shows the number of ancestors you would have at each Gen going back – another inversion list. For example: if you and your Match are 8C, you would each have 512 ancestors at your Common Ancestor level. In other words the CA is 1 of 512 ancestors. It’s a handy lookup feature of Figure 1.
Endogamy factor – I have noted this chart as Endogamy 1 [E1], meaning both you and your Match only have the CA in your ancestry once. More on this later.
Modified Base Chart (Cousin Ancestors) [E2]
Now let’s modify the Base Chart and show you having two of the same Common Ancestor (A1 and A2) whose Great grandchildren married each other.
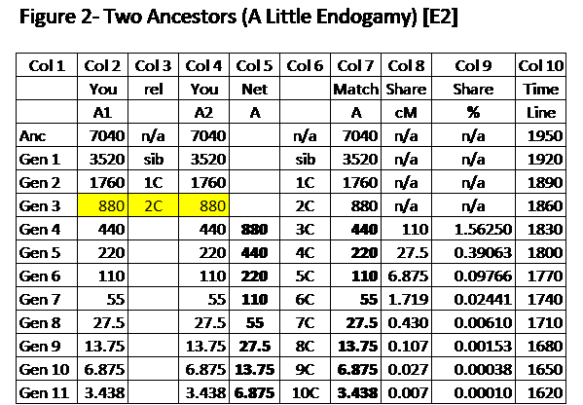
Explanation of Figure 2.
Columns 1-4 are similar those columns in Figure 1 with three important differences: (1) they are both on your side (2) the two 2C at Gen 3 marry each other, and (3) in Gen 4 the 440cM which was passed down from Gen 3 for each of A1 and A2 are shown, as well as that amount being combined into a total of 880cM for the single descendant (child) in Gen 4. In succeeding generations the DNA is halved at each generation.
Column 5 shows the net (combined) amount of DNA from A (A1 + A2) for the descendants of the Gen 3 marriage, starting in Gen 4. The net DNA is now twice as much as it was in Column 2 for Gen 4 in Figure 1.
Columns 6-7 are the same as Columns 3-4 in Figure 1.
Columns 8-9 have twice the values at each Gen compared to Figure 1. The shared DNA is now twice as much (by total and percentage).
Endogamy factor – With 2 identical Common Ancestors in your Tree, we have E2.
Important Note: When the DNA is passed from the Gen 3 parents (A1 and A2) to the Gen 4 child, the Gen 4 child gets the total DNA from A1 in various segments on one set of chromosomes (say the paternal side), and the DNA from A2 on the other set of chromosomes (the maternal side). There is no mix at this point. The various segments are subdivided, or not, and passed down normally. In the next generation, the Gen 4 child will recombine both chromosomes and pass the DNA to the Gen 5 child. There is a small probability that some segments from ancestors A1 and A2 may be exactly the same, but they would be on opposing chromosomes in Gen 4 and only one segment area could be passed on to Gen 5 child. There is a very small probability that separate, but adjacent, segments from A1 and A2 (on opposing chromosomes) could wind up adjacent again in Gen 5 child, and be “stitched together” to form a larger segment in Gen 5 from ancestor A than there was in Gen 4. Note that this very small probability can only happen in this one generation (the generation of a child with cousin parents passing DNA to his/her child; in this case Gen 4 to Gen5). In succeeding generations, all the segments for ancestor A are on one side, and can only be subdivided.
Key Findings
Total DNA – As it turns out, no matter where in your ancestry the cousins marry each other, their descendants will have twice the DNA from the Common Ancestor. It doesn’t matter if first cousins or fifth cousins marry, their descendants will carry twice the total Common Ancestor’s DNA (on average). And it doesn’t matter if cousins married recently or 6 generations back, their descendants will carry twice the Common Ancestor’s DNA. This simplifies the analysis a lot!
Shared DNA – the amount of shared DNA will double (with this E2 scenario). An E1 5C = 3.438cM (see Fig 1); an E2 5C = 6.875cM (see Fig 2)
Net effect – With E2 the shared DNA is equivalent to an additional “once removed” in the cousinship. A true 5C Match (normally sharing 3.438cM with E1), with E2 would look like a 4C1R (6.875cM)
Segment Sizes – Although, on average, the total DNA will be doubled, the various segments will not be larger, in general. For sure, the segment sizes are not doubled!
Modified Base Chart (3 Identical Common Ancestors) [E3]
Suppose you have three identical Common Ancestors (A1, A2 and A3) in your Tree. Usually this means two cousin marriages involving the same ancestor.

Explanation of Figure 3.
The columns are similar in function to that of Figure 2.
In Gen 3 two 2nd cousins, the highlighted descendants of A1 and A2, marry. Then in Gen 4, a child from this marriage, marries a descendant of A3, also highlighted.
Columns 2, 4 and 5 show the “half-amount” of DNA from ancestors A1, A2 and A3 that continues to add up in each generation (see Column 6). Note this is always the sum of respective portions from A1, A2 and A3, AND in Column 6 the net amount is halved in each succeeding generation.
Columns 9 and 10 show three times the total shared cM and total percent shared.
Endogamy factor – With 3 identical CAs in your Tree we have E3.
Modified Base Chart (2 Identical CAs plus 2 Identical CAs) [E4]
Let’s try an example with cousins in your Tree and cousins in your Match’s Tree. The process should be familiar now.

Explanation of Figure 4.
See previous Figures for explanations of the Columns.
As before, in Gen 3 two 2nd cousins in your Tree marry, and all succeeding total DNA is doubled.
In Gen 4 two 3rd cousins in your Match’s Tree marry, and all succeeding total DNA is doubled.
To get the shared DNA at Gen 5 we take the A1 DNA (220cM) compared to A3 DNA (220cM), and from Figure 1 we know this is 13.75cM, We then compare A1 to A4 and get 13.75cM; as is A2 to A3 and A2 to A4. So we have a total of 4 times 13.75cM or 55.0cM total shared. Here we have E2 on your side and E2 on your Match’s side.
Endogamy factor – E2 x E2 is E4.
Modified Base Chart (3 Identical CAs plus 2 Identical CAs) [E6]
So you might ask in the previous chart, do we add (E2 + E2 = E4) or multiply (E2 x E2 = E4)? Let’s resolve this in the following figure.
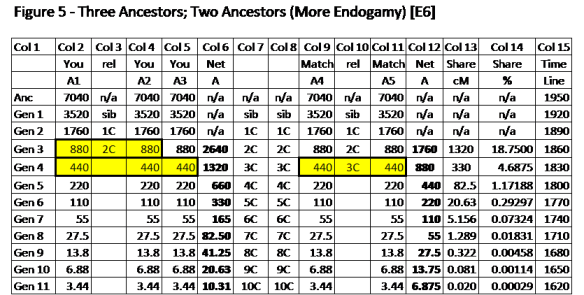
Explanation of Figure 5.
This is the reason why I continue to separately show the total contribution of DNA from each of the Ancestors (A1, A2, A3, A4, and A5 in this case). I don’t know how to compare 660cM and 440cM in Gen 5 to get the shared cM. But comparing these 5 ancestors in separate pairs means we can use shared values we already know from Figure 1. In this case, compare at 220cM for A1-A4, A1-A5, A2-A4, A2-A5, A3-A4 and A3-A5 – a total of 6 sharing comparisons. So we use E3 x E2 = E6.
Endogamy factor is E6; and we can multiply the 220cM-220cM share (13.75cM from Figure 1) by 6. Or 13.75cM x 6 = 82.5cM.
Common Ancestor is in only in each Tree once [E1]
What happens if we have lots of endogamy in our ancestry, but the Common Ancestor with a Match is not repeated in either Tree? Well we would not have any effects of endogamy. The Endogamy factor would be E1, and we’d use Figure 1. The multiplying effect of endogamy on shared DNA only comes into play when the Common Ancestor between you and a Match is repeated in your Tree or in your Match’s Tree.
Modified Base Chart (Common Ancestor is below Endogamy) [E1]
What happens if you and your Match have a Common Ancestor with lots of endogamy? In other words the Common Ancestor is the descendant of endogamy. The analysis of shared DNA is always done by starting with the Common Ancestor’s total DNA [7040cM, or 100%], and working down from there.

Explanation of Figure 6.
You can put as many identical Ancestors as you want in this chart (like A1 and A2 above, or the example in Figure 5). But to determine the shared DNA from a Common Ancestor, you must start with that ancestor – noted as B in Figure 6. In this example, ancestor B is only in your Tree once and your Match’s Tree once, notwithstanding the fact that B has multiple A ancestors. B is a separate, individual ancestor and the shared DNA from this B ancestor must be calculated with B as the base.
Endogamy factor is E1 in this case. There is no change in the amount or percentage of shared DNA with any cousin on Common Ancestor B in this case.
Summary Findings:
Total DNA in descendants of multiple Common Ancestors is multiplied by the number of CAs. It doesn’t matter how distant the marrying cousins are or where they are in your Tree. The number of Common Ancestors in a Tree determines the Endogamy factor – a CA in a Tree three times is E3, for example.
Shared DNA with a Cousin is multiplied by the Endogamy factors of you and your Match.
Endogamy only affects the shared DNA from the Common Ancestor between you and a Match.
- General endogamy, or “population endogamy”, does not affect the shared DNA calculation, except as it applies to the specific CA.
- Specific endogamy on Ancestors other than the Common Ancestor does not affect the shared DNA calculation.
- Endogamy ancestral to the Common Ancestor with a Match does not affect the shared DNA calculation
- If you know all 8 of your Great grandparents are different, and/or all 16 of your 2xGreat grandparents are all different, and/or can be sure (say by geography, ethnicity, etc.) that none of your 32 3xGreat grandparents are repeated as your ancestors, then your Endogamy factor would be E1 (use Figure 1) with any Match who is a cousin from one of these ancestors. If you are positive that any other more distant ancestor was in your Tree only once, the Endogamy factor is E1. However, you also need to consider the Endogamy factor of your Match.
Endogamy must be considered for both you and your Match.
- Use an Endogamy factor, E, for each time the Common Ancestor is in your Tree and/or your Match’s Tree.
- If the Common Ancestor is in a Tree only once the Endogamy factor is E1; twice E2; three times E3, etc.
- Multiply to combine Endogamy factors from you and your Match. Examples: E1 x E1 = E1 (no endogamy); E4 x E2 = E8, and the total amount of shared DNA in Figure 1 for that Gen is multiplied by 8. An E8 5C would share 8 x 3.438 = 27.5cM, which would look like a 3C1R.
Perceived effect of endogamy is the equivalent of one additional “once-removed” for each additional CA involved. So a true 4C (usually sharing 13.75cM), would share 27.5cM with E2 and look like a 3C1R, or 55cM with E4 and look like a 3C. Referring to Figure 1 at the 4C level, we have 32 ancestors, and so does our Match. So to reach E4, both you and the Match would need to have the 2xGreat grandparent (CA) in your Tree twice, for example.
If all or much of your ancestry is in one “pool” of endogamy, the opportunity for large Endogamy factors is great. If various branches of your ancestry come from very different geographic areas or ethnicities, etc., the Endogamy factors will be smaller. You might want to examine various parts of your ancestry to see where endogamy might play a role. Endogamy means more shared DNA, which will also mean more Matches.
The size of shared DNA segments is not, generally, changed by endogamy. Certainly, endogamy does not double the size of shared segments.
Summary Thoughts
This has been an interesting drill for me (I’m sorry for all the tables and numbers).
This article is based on the calculated averages – “your results may vary”. I am certain that many of our Matches are in the 6th to 8th cousin range, and our shared DNA is based on both endogamy and the long “tails” on the cM distribution curves.
I hope this blogpost will help facilitate further discussion of endogamy in genetic genealogy.
07D Segment-ology: Endogamy I – Shared DNA by Jim Bartlett 20151202
* At www.isogg.org/wiki/CentiMorgan the atDNA totals are 6769cM at FTDNA; 7174cM at GEDmatch and 7075cM at 23andMe; and ISOGG uses 6800cM at www.isogg.org/wiki/Autosomal_DNA_statistics. Other sources have different totals.
