TG SUMMARY Spreadsheet

This is my ultimate spreadsheet, so far. I think it’s use will be profound.

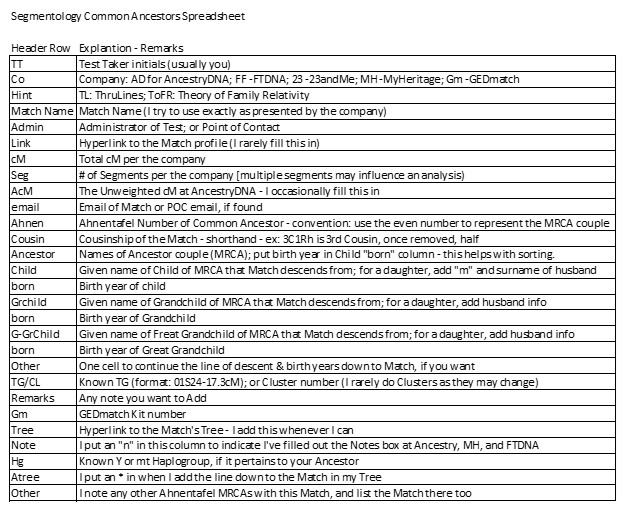
The spreadsheet and data are pretty simple. Here are the header titles:

Side – Paternal or Maternal [I use Ahnentafel number 2 or 3]

Chr – Chromosome number (1 to 23)

Start – the Start location of each Triangulated Group (TG) use Mbp with one decimal

End – the end location of each TG (Mbp) NB: End of one TG = Start of next TG

Mbp – calculate End minus Start; this is “roughly” the cM (real cM is too hard to calculate)

TG-ID – An ID for each TG – Example 01S2 – on Chr 01, Start ~130Mbp, on 2 side

                For more see: Shorthand ID for TGs

G2 – second generation back, column for Ahentafel number for my Ancestor

G3 – Ahnentafel for one of my grandparents; similar for other generations below

G4

G5

G6

G7

G8

G9

G10

CZN – Cousinship of Most Distant Common Ancestor (MDCA) in this TG [within reason]

MDCA – the surnames of the MDCA Couple Ex: SNIDER/BRITZ

Remarks – a place for any discussion I want about a TG – I could write a book in this cell.

For the spreadsheet header, just type in the above list (to the left of the hyphen) across the top row.

This simple spreadsheet has two parts:

1. Side|Chr|Start|End|Mbp|TG-ID – this describes each TG. I have 372 TGs so my TG Summary Spreadsheet has 372 rows of data. Having already done segment Triangulation of all my Matches at FTDNA, 23andMe, MyHeritage and GEDmatch, this part of the TG summary was a snap. And these data points remain fairly static. I say “fairly” as from time to time, as new Shared DNA Segments are found and new MRCAs determined, I do make minor TG end-point shifts and/or combine or split existing TGs.

2. G2-G10|CZN|MDCA – this part summarizes the genealogy – the Most Recent Common Ancestors (MRCAs) I have with Matches in the TG; and my best, conservative, judgment of what is the MDCA for the whole TG, so far. For each of the reasonable MRCAs in this line I enter the Ahnentafel number of the MRCA – bolded and yellow-highlighted – under the appropriate Generation. See the Figures below. This represents the data that I’m comfortable with. The goal is to Walk the Ancestor Back in each TG, and/or to find multiple, separate Matches who agree with the Ancestral line. In some cases, where I have sufficient evidence, I underline the Ahnentafel numbers to indicate I’m confident with the result. In the other cases the Ahnentafel numbers are clues, and more data is needed. In some TGs I have no MRCA, yet. In just a few TGs (less than 10), there are no Match-segments (beyond very close relatives) – these are small gaps in the overall Chromosome Map.

Both of the two parts above come from my atDNA Master Spreadsheet which has all my Shared DNA Segments with Matches. That spreadsheet is now over 20,000 rows – this TG Summary spreadsheet is 372 rows which I can print out in two pages back to back. A very handy scrap of paper.

This is the spreadsheet version of DNA Painter. In fact I once painted the 372 TGs. And I did the same with Kitty Cooper’s Chromosome Painter program.

Several  observations about this TG Summary Spreadsheet:

1. It is a summary! It extracts the important essence from 20,000 rows of data into 372 rows.

2. Trends – By bolding and highlighting my Ahnentafel numbers I can readily see trends and/or conflicts.

3. Pointers – For TGs with strong evidence of an MRCA, this information is very valuable in looking at other Match Trees in the TG. *Knowing* the TG MRCA is a powerful pointer, which has helped me find MRCAs with many more Matches (including those with only one Ancestor in their “Tree”). This summary has become a powerful TOOL in this respect.

4. Fill-in – In many cases, based on high confidence MRCA Ahnentafels, it is easy to “fill in” the other Ahnentafel numbers leading up to the TG MRCA – these “fill ins” identify the Ancestors who “had to be there” for the DNA to pass down to me.

5. Crossover points – With “filled in” Ahnentafels, it’s easy to see where the crossovers occurred between TGs in a Chromosome. If one TG row has Ahnentafels 2-5-10-21-42 and the next row has 2-5-10-20-40, it’s easy to see the crossover occurred between 21 and 20. In this case, Ancestor 10 had these two adjacent TGs in their DNA – one from his mother (21) and one from his father (20), which he (10) recombined and passed as a single, larger TG segment to his daughter 5. A first cousin (1C) might share that larger segment with me. And, of course, parent 2, would have also passed that *double* segment to me intact as part of that Chromosome. In other words, as we fill out the MRCA Ahnentafels, we can track the crossover points, generation by generation.

6. Crossover points per generation – This also gives us the ability to easily count the crossovers per generation. Will we see the 27 male vs 41 female distribution? On the paternal side we can see how many times the TGs shifted from 4 to 5 (or 5 to 4) [no matter what distant MRCA each of those TGs eventually went to after that]. How many 8 to 9 and 10 to 11 cross overs will there be – will it stay near 27 or tread toward the 34 average?

7. Quality Control – The Crossover points per generation summary may be a good QC check – if our result from the TG Summary Spreadsheet is reasonable. If my TG summary shows a lot of change between TGs, I might show 50 or 60 crossovers in a generation – that seems unreasonable to me, and I would be looking over my TGs. It would be relatively unusual for a Chromosome to shift from one grandparent to another and then back again several times on one Chromosome – it’s more likely that I had several MRCAs in a TG and selected the wrong one.

8. Predictive – I have some TGs with no or a very close (2C) MRCA. In some cases, it’s where much of the Chromosome is from one grandparent. If one TG in the middle is from the other grandparent, that adds two crossovers to the total. Although I’m pulled toward the parsimonious solution, I have to ALWAYS keep from jumping to a conclusion. On the other hand, if my total crossovers for the generation is high, I need to look hard for errors I might have made.

9. Brick Walls – In some TGs I have several Matches at, say, the 4C level, and a lot of other Matches, some with good Trees, but no MRCA beyond 4C level. All other things being equal, I should have some 5C and 6C Matches in that TG (I have ThruLines Matches at Ancestrycom for all of my known 6C Ancestors, so I know the genealogy is there if the TG was really from one of them). So I conclude that those TGs are probably headed past the 4C level and on through a Brick Wall. I’ve used this conclusion to successfully use Match Trees to find a Common Ancestor in two TGs with Brick Walls; and in one case where I had an incorrect Ancestor. Where there are a lot of Matches in a TG with closer Cousins, I am suspicious of an Ancestor I haven’t identified. Alternatively, I also have some TGs with no close Matches and lots of distant apparent Matches – sort of like a pile up area. This situation leads me to believe the MRCA may be at the fringes of my genealogy or beyond. Maybe adjacent TGs will be able to help…

10. Chromosome Maps/Generation. As I’ve mentioned in several blog posts before – each parent gives us 23 chromosomes and all 3 billion base pairs in a genome. On each side, our two grandparents provided segments that account for the same 3 billion base pairs – through roughly 57 segments that cover all of our Chromosomes. And so it goes for each generation – our Ancestors in each generation provide sufficient segments to fill up all our Chromosomes. With this TG Summary spreadsheet, it’s easy to see the segments from any Ancestor in a generation. For instance my father’s mother’s Ahnentafel is 5 – I can look down column G3 and see which TGs have a 5 and easily note the appropriate Start and End points to get the Mbp for each grandparent segment (or I could resort the spreadsheet on column G3 and just sum the 5s). Repeat for Ahnentafel 4 – the sum of Mbp for 4 plus 5, had better add up to the whole for that side. [arithmetic check!] I could Paint or map those segments which would cover all of my Chromosomes. Do the same thing with Ahnentafels 12 through 15 on my maternal side to map (or Paint) my great grandparent segments.  It all depends on how much of the TG summary I can fill out.

11. Sticky Segments – It’s easy to see “Sticky” segments – a segment of DNA that must have traveled down many generations intact to get to me. See TG 09A24 in Figure 3 below. Yes, this segment probably started out somewhat larger, but the segment I have in my body (TG 09A24) had to persist from Ancestor 354, through 8 generations, to me.

12. Progress – This TG Summary spreadsheet offers a good way to track your progress (if your objectives include linking Ancestors to Segments, or “proving” your Tree with DNA).

13. Focus – In any case, this TG Summary spreadsheet helps me focus on the *Most Distant Common Ancestor* Chromosome Map objective.

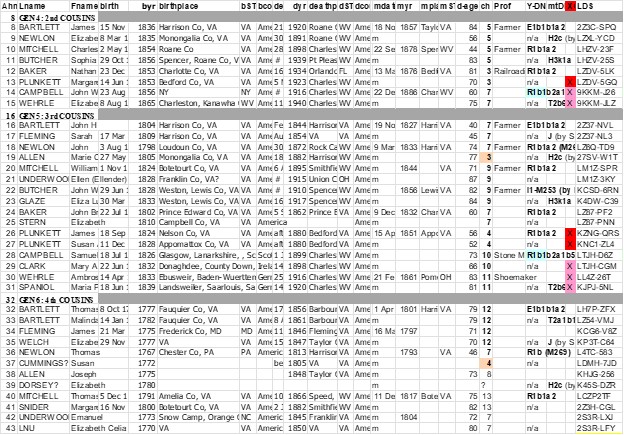
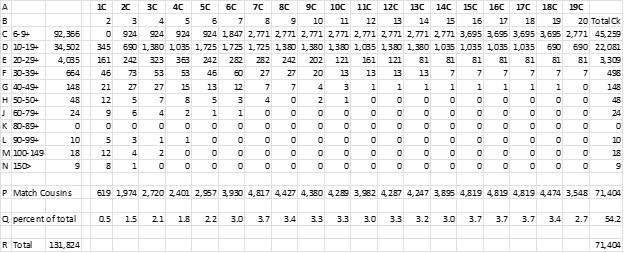
Here is part of my TG Summary Spreadsheet only with known MRCAs (bolded  & highlighted) Ahnental numbers :

Figure 1

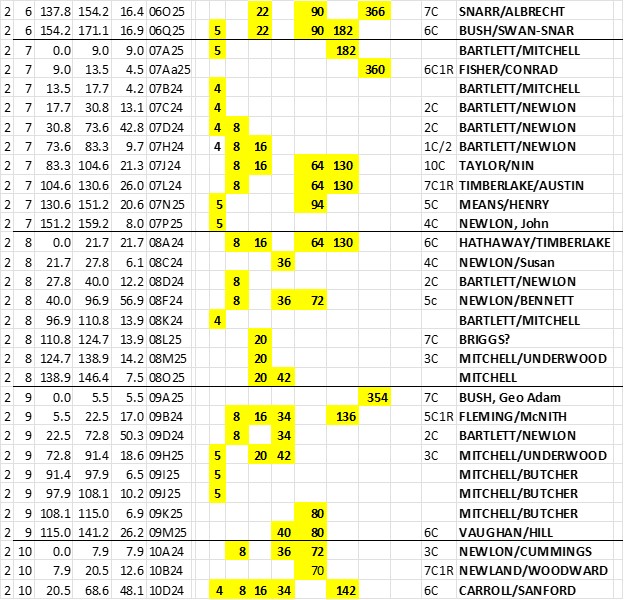
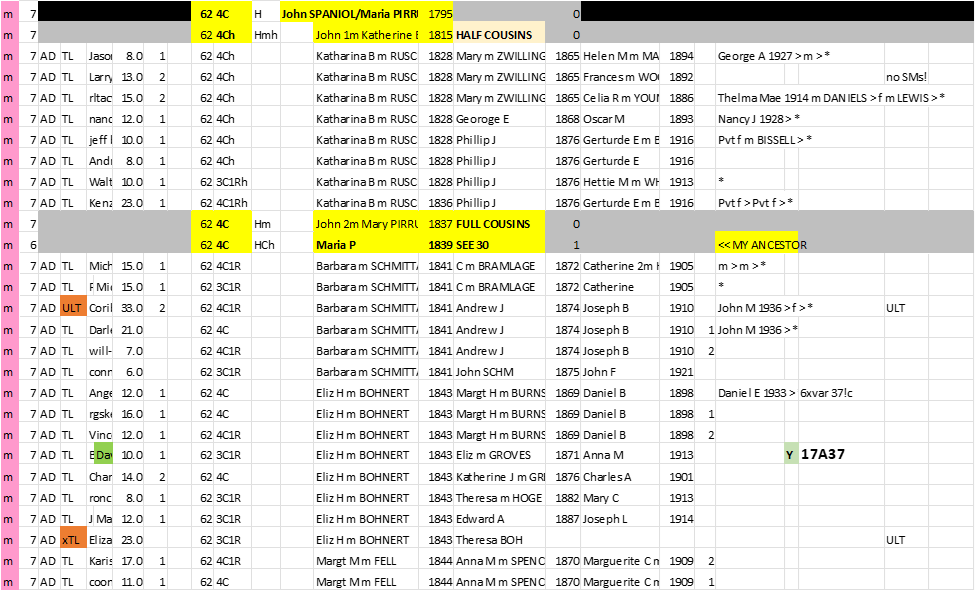
Next is part of my TG Summary Spreadsheet including “must be” Ancestors. And a few of the known, even numbered (husband) Ahnentafels were changed to odd (wife) Ahnentafels – as appropriate.

Figure 2.

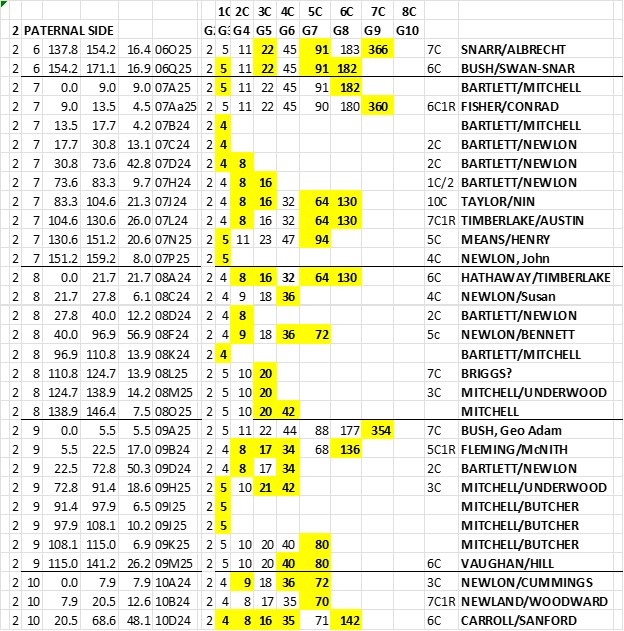
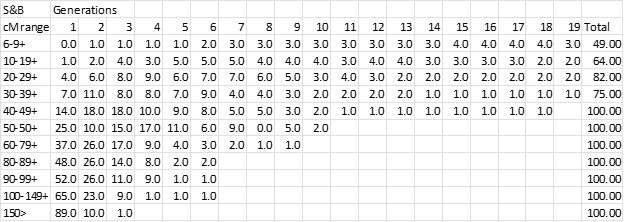
Now, below, I’ve added some double underlines at crossover points:

Figure 3.

NOTES on this Figure 3:

1. Note the 183 to 182 crossover between TG 06O25 and 06Q25. Ancestor 91 had the two segments as maternal and paternal segments and passed them on as a full maternal segment to Ancestor 45, which then must have been a “sticky segment” down to me.

2. Note TGs 08A24 through 08F24 appear to flip-flop from 8 to 9 to 8 to 9. That almost certainly would not happen. And upon examination I see that TG 08D24 should have been changed from 8 to 9 [NB: by convention I use an even Ahnentafel to represent an MRCA couple, which is this case would have been 8 & 9– so the 08D24 8 has an equal chance to be a 9. Given that both adjacent TGs are a 9, the best guess is to make it a 9. Then there is 1 crossover instead of 3.

3. While we are looking at Chromosome 8, it looks like the 9 will crossover to a 10 before 08L25 starts; but the crossover will actually be in G3, and TG ID 08K24 could be either a 4 or a 5 in G3. This would mean one crossover in Chr 8 in Gen 3 – highly probable for Chr 8.

4. Look at TG 09A25 – two things: although it’s 5.5Mbp long, don’t be fooled – most of the Shared DNA Segments in 09A25 are 15cM segments; and only one Match has a distant MRCA at Ahnentafel 354 – this is a fairly iffy, and I would not be surprised if someday I found a closer paternal cousin on this segment – even one on a 2-4 branch (but for now this is the only clue I have for this TG, and I’ll keep it until something better comes along).

5. Look at TGs 07L24 and 07N25 – there is a crossover here at G3, and the two TGs go back in two very different directions (to two very different geographic areas). I generally find that this type of crossover is fairly crisp, and easy to identify. Other TGs with crossovers somewhat more distant seem to have a fuzzy overlap – often the crossover point cannot be readily pinned down. I such cases I just pick a compromise crossover point. As I’ve noted before, our focus should be on the bulk of the TG segment, from an Ancestor, and not be too concerned about a little fuzzy overlap of TGs.

SUMMARY THOUGHTS

REMEMBER: Your Ancestry is a very unique arrangement of Ancestors – which does not change. Your DNA is a unique tapestry of segments and crossover points – which does not change. Your DNA is linked to your Ancestors in one way – which does not change.

All of our tools help us to determine our Ancestors and segments and how they are interconnected. The Leeds method and Virtual Phasing can help with Generation 3 (G3 above) – the results should be the same as your grandparents and your grandparent segments. DNA Painter can help paint the same segments you see in the TG SUMMARY above – but more colorfully, and perhaps closer to your style of figuring things out. Clustering (in all its various manifestations); Shared Matches (aka In Common With; Relatives in Common, Shared DNA Matches); segment Triangulation (by GEDmatch, MyHeritage, 23andMe, or DoubleMatch Triangulation at FTDNA; or through a Spreadsheet, as I do); and Trees and genealogy Tools primarily at Ancestry – are all good tools that are designed to help find Common Ancestor and DNA segments. Use the tools that work best for you. This TG SUMMARY may also help you.

SUMMARY – NB: This spreadsheet summarizes WORK. It summarizes the segment Triangulation of many DNA Matches – not an easy task, but one when accomplished, remains relatively static. It also summarizes a lot of genealogy WORK determining Common Ancestors with our Matches. As we document our TGs and dig into the genealogy, we begin to build a mountain of evidence linking our Ancestors to our DNA, and vice versa.

[35BE] Segment-ology: TG Summary Spreadsheet by Jim Bartlett 20211222

Ancestor Spreadsheet

The most important spreadsheet for the genetic genealogist, IMO, has nothing to do DNA or segments – it’s an Ancestor Spreadsheet. A simple spreadsheet of Ancestors is a very valuable tool.

This spreadsheet starts off very simple and can expand any way you want. Here are the column headers:

Ahnen – Ahnentafel number (this is a key to sorting and will help you in other ways, too)

L Name – Surname

F Name – Given name(s)

B Date – Birth date (pick a standard format and stick with it)

B yr – Birth year

B Place – Birthplace

B St – Birth state

B Co – Birth country

D Date – Death date

D yr – Death year

D St – Death state

D Co – Death country

D cause – Cause of death

M Date – Marriage date

M yr – Marriage year

M Place – Place of marriage

M St – Marriage state

M Co – Marriage country

I Date – Immigration date

Remarks – Add anything you want

D age – Age at death [D yr minus B yr] [also serves as a Quality check]

M age – Age at marriage [M yr minus B yr] [also serves as a Quality check]

Ch – number of children

Rel – religion

Prof – Profession

Mil – highest level

War – RevWar, 1812, CivWar, etc.

Y-DNA [halplgroup of all male line]

mtDNA [haplogroup of all female line]

FG – Find-a-Grave [I paste in the hyperlink for easy access]

LDS – The FamilySearch ID# for the Ancestor [this may change from time to time]

For the spreadsheet header, just type in the above list (to the left of the hyphen) across the top row.

I started with a Tree at Ancestrycom that was mostly just my Ancestors – Click on Tree search (top right); then select ‘List of all people”; then highlight that list and paste it into a spreadsheet. There is still some amount of manipulation, but I had a good base to start. Or you could just type the spreadsheet from scratch. Or perhaps manipulation from a GEDcom or other Tree software.

Here are some benefits and things to do with this Ancestor Spreadsheet:

1. First – this is your personal spreadsheet – modify it any way you want – you can delete any columns you don’t want and/or add any new columns for data you want. You can hide any column(s), so that only the information you tend to use all the time is shown (you can unhide at any time).

2. This is a very handy inventory of your Ancestors – a printout will only be a few pages.

3. This is an easy repository of key data elements of your Ancestors

4. This is my go-to lookup table for Ahnentafel numbers

5. A searchable database

6. A variety of spreadsheet sorts:

                A. Ahnentafel sort – groups husband and wife together and by generation

                B. Surname + B yr – groups surname lines in chron order => surname lineage

                C. B St – groups Ancestors by states; sort on “B county”, if you add that column.

7. I include Potential Ancestors, but highlight them as Potential.

8. I include “Alternate” Ancestors (also highlighted), when there is an unresolved alternative.

9. Blank spaces can highlight data you don’t have – they are a good tickler for what you need to research. Periodically, I’ll select one to tackle.

10. Add an additional row for each generation – this is a “separator” between generations; Example of the text in a Generation row:  32 GEN 6; 3xG grandparents; 4th cousin Matches [where the 32 is in the Ahnen column.

11. I select a some columns that will fit on one page, and hide the rest, and print out about 4 pages (the top Ancestors) which I always have handy – particularly while traveling.  I refer to this spreadsheet literally every day – so, IMO, it’s worth the work it takes to prepare it.

12. Please post any additional uses you find for this Ancestor Spreadsheet.

Here is an example of part of my Ancestor Spreadsheet:

Figure 1:

NOTES

1. This is just a sample; some columns have been hidden or reduced in width to get a lot in the picture.

2. This Ancestor Spreadsheet is not intended to replace my on-line Tree(s) which are full of documentation. This has key data, and an Ahnentafel place holder for every Ancestor. Ancestors in my Tree more than once are in this spreadsheet more than once – it helps to understand Pedigree collapse.

[35BA] Segment-ology: Ancestor Spreadsheet by Jim Bartlett 20211222 [Edited 20211223]

Segmentology Common Ancestor Spreadsheet

I’m going to try a format here that will make it easier for me to explain some of my spreadsheet tools, and give you an easy way to copy the header (you can adjust the column widths to suit your self). Please let me know if this works for you, and I’ll try some more of them.

Copy the above column titled “Header Row” and paste it into your spreadsheet using the Transpose option. It should create the Header Row for the Common Ancestor Spreadsheet.  [Edit: it appears this doesn’t work from the image above – so just type them in a row across a spreadsheet.]

There are several types of rows for you to input:

1. Include one row for each of your Ancestor Couples – I highlight these rows      

2. There is one row for each Match with each known Common Ancestor (MRCA);              

3. I add a row for my MRCA Child & birth year with a NOTE to refer to appropriate Ahnentafel for more  

4. I add a row for Ancestor multiple marriages, and put marriage year in born column      

                This separates full cousins and half cousins.

5. If something looks fishy, or needs more investigation, I highlight it in orange/mud color.             

6. If an Ancestor/Ahnentafel number and a TG are in conflict, I highlight it in red. The genealogy may be correct but the shared DNA segment did not come from the MRCA         

Other NOTES:   

1. The main sort for this spreadsheet is Ahnen + born+ born +born columns         

                NB: Highlight all columns before sorting.

2. Another sort is on Match Name to analyze multiple MRCAs – only one TG per MRCA    

3. If you want to compare spreadsheets for different Test Takers, be sure to fill in the TT column first. Combine spreadsheets, sort, analyze, then sort on TT and separate the spreadsheets.       

4. Sidebar: I have an Ancestor Spreadsheet – one row for each Ancestor info, including the Ahnentafel number!  

5. I have typed all the data into my Common Ancestor spreadsheet – a lot of work             

                Idea: If you have a download of AncestryDNA Matches, start with that data for ThruLines Matches

6. If you want to be able to sort this by side (your paternal and maternal sides); add a column for P or M (or 2 or 3)               

7. Do not hesitate to add any other columns (or rows) that may be useful to you. I made up this spreadsheet, feel free to change it as you like.

 ADVANTAGES OF THIS COMMON ANCESTORS SPREADSHEET      

1. It captures all of your Matches with Common Ancestors [some may be gone tomorrow…]        

2. It arranges the Matches’ descendants from the MRCA like a Family Group Sheet           

                Easy to compare with your own research

                Helpful in spotting many errors

                Easy to see Matches who are relatively close cousins to each other – good conversation starter

                Easy to highlight real and/or potential errors

                Easy to spot a Match at two companies with different names

3. Shows TG threads in a family [maybe Clusters too, haven’t tried them yet)       

                Makes it easy to spot TG threads through a family (closer Ancestors will have more TG threads)

Here is an example from my CA Spreadsheet:

[35BC] Segment-ology: Common Ancestor Spreadsheet by Jim Bartlett 20211219  

Using MyHertiage Labels for Triangulation

My Heritage just released an improvement to their “labels for DNA Matches”. See their blogpost at: https://blog.myheritage.com/2021/12/labels-for-dna-matches-now-improved/

These are intended to help you organize your DNA Matches into groups. And, AND, AND … you can “Export entire DNA Match list” (click on the 3 vertical dots to the right of Filters and Sort by), and this spreadsheet will include a list of any labels associated with each Match.

This is a huge time saver for Triangulation. To the extent that we can identify our Matches as Paternal and Maternal, the Triangulation process becomes very simplified. Paternal side Matches will only Triangulate with other Paternal side Matches. NB: watch out for any Matches that may relate to you on both sides. For the vast bulk of our Matches, however, all we have to do is sort by side + Chr + Start and form groups.

If you’ve already done a lot of Triangulation, this will provide a good Quality Control check.

There are a few pesky details: you have to assign the dot labels*…; you have to merge the Match list with the segment list…; you have to analyze the start/stop locations and make a judgment call as to where the Triangulated Group starts and ends.  But aside from these chores, the main headache of checking for Triangulation is gone. Having the effect of “phased data” means the shared segments on one side have to Triangulate only with other segments on that same side.  *Clustering and Shared Matches will often indicate that we can assign “side” labels on a group basis. Triangulated Icons should always indicate the same “side”.  

[10D] Segment-ology: Using My Heritage Labels by Jim Bartlett 20211215

Distribution of Cousins

This blogpost is overtaken by a better analysis by Kurt Allan, based on other analysis by Louis Kessler and information from Doug Speed that his chart was intended for a different purpose and might not apply to genetic genealogy. The result is a spreadsheet similar to the one below, but with a more normal distribution curve with 7C-9C occupying the mean. This is very good news for genetic genealogists – most of our Matches are well within a genealogy horizon. I hope to be able to post or link to Kurt’s final graphs soon.

A recent discussion on the Genetic Genealogy Tips & Techniques facebook page asked about what percent of our DNA matches we should expect at various genetic distances. I’ve often wondered about this too. As I thought about it, we should be able to apply the “Speed and Balding” analysis to this question. The S&B graph shows the probability of a matching DNA segment at different generations (think cousins), for given ranges of shared DNA. See the graph at the ISOGG wiki here.

I scaled each “bucket” in this chart as best I could and put the bucket percentages in an excel spreadsheet – see below.  In the Speed and Balding chart, cM ranges are along the x-axis; percentages on the y-axis; and the “generations” are shown as stacked bars (or “buckets”) for each cM range. The numbers in the body of this chart are the percentage for the cM range and Generation.

I had in my files a complete download of my AncestryDNA Matches by DNAGedcom Client from several years ago, before the Ancestry purge of 6-7cM Matches. I had 131,824 Matches and it was easy to sort by cM and determine the total number of Matches for each column (cM range) in the S&B chart.  Finally I applied the S&B percentages to my breakdown of Matches to get the following  chart.

I know it’s a “squinter”, but I wanted to show the whole spreadsheet. Here are explanations of the lettered rows:

A.            The cousinship which corresponds to the S&B generations back

B.            Speed & Balding generations

C-N.       The first column is cM range groups that correspond to the S&B chart.

C-N.       The second column is the number of my Matches in each category –131,824 Total.

C-N.       The next columns: multiply S&B percent by number of Matches in the cM range

P             Total number of Matches for each cousinship

Q             Percent of cousins vs the 131,824 Total

Key points

1. I could be off by a percent or two in my scaling of a printout of the Speed and Balding chart – but the totals are pretty close, and what I am really looking for is trends and order of magnitude.

2. Line Q, percent of total, was a lot flatter than I had expected – less than 4 percent for any cousinship. I had expected something closer to a normal distribution curve – even a long one, but with a “hump” somewhere. This indicates the two competing factors: an increasing number of cousins with each generation going back, verses a decreasing probability of a shared DNA match (above 6cM) with each generation going back.

3. There are a lot of Match-cousins to work with. Although only about half of all our Matches would be related to us out to the 19th cousin level; nevertheless, there are thousands of cousins in every cousin “bucket”.

4. In my own case I need to use judgment and temper some of these results. Both of my parents were only children, so I have no 1st Cousins. And my great grandparents did not have large families, so I also don’t have many 2C. However, I do have about 300 3C Matches and 600 4C Matches identified, so far, and there are plenty more out there (at least per Speed and Balding). And I am finding many 5C-8C Matches (but my known Tree begins to thin out after that.)

My Takeaways

1. Autosomal DNA “works” throughout a genealogy horizon for most of us.

2. The limiting factor is NOT the atDNA, it’s the genealogy – the lack of good Trees among our Matches; and the shrinking body of documentation the farther back we go.

3. When Matches Triangulate or group in Clusters, it’s often worth the effort to extend their Trees and find the Common Ancestor.

This blog post is one in a series to try and outline what you can generally expect – to put some generalized boundaries on genetic genealogy.

Anyone is welcome to use my estimate of the S&B data in the first spreadsheet, and apply it to the distribution of your own Matches. Please let me know if you see a glaring error in this process or the results.

[06D] Segment-ology: Distribution of Cousins by Jim Bartlett 20211209

Genetic Genealogy Spreadsheets

Spreadsheets are an important tool in Genetic Genealogy. Here are some of mine…

ANCESTORS – Names, dates, locations, and Ahnentafel # are the key foundational data in this spreadsheet. Over time I’ve added columns for: Immigration year; age at death, age at marriage, number of children, Religion, Profession, Military, War, Y-haplogroup, mt-haplogroup, Find-A-Grave hyperlink, remarks. Add any other column of interest to you – you just need to fill it in… I add in Potential (or Alternate) Ancestors (highlighted) to keep track of those possibilities.  I have a “dup” column to indicate which Ancestors are duplicates. This is a very handy reference for me. Two main sorts – 1) by Ahnentafel #; and 2)by surname & birth date. [Initially I took a GEDcom of an Ancestors only Tree and put it into a spreadsheet – then massaged the columns]

COMMON ANCESTOR MATCHES – Names of all Matches who have a Common Ancestor(s) with me. Key data: Name, Admin, cM, #Segs, Company, CA Ahnentafel #, Cousinship, columns for name and birth year of child, grandchild and great grandchild of CA (for Match’s line of descent); hyperlink to Tree. I also have columns for TG or Cluster, GEDmatch #; Remarks. I also have columns to indicate (to me) if I’ve filled in the Notes box of the Match, entered the line of descent to the Match in my Tree… Main sort is by Ahnentafel # and dates of Child, Grchild – this sort looks like a Family Group Sheet – and is very helpful in tracking TGs and Clusters. It also lets me focus on family groups which often group together in TGs or Clusters.

TG MASTER – Match name, company, Admin, email, Segment info (Chr, Start, End, cM, SNPs), TG ID, Side (M or P), CA info (Ahnentafel #, Surnames of Couple, Cousinship, Tree hyperlink); GEDmatch #; date. If you plan this type of spreadsheet for other people, add a column for initials of test taker (you can then, briefly, combine spreadsheets, do analyses, then separate them again – one spreadsheet per person). Advanced: I have columns for each of 10 generations, and enter my Ahnentafel #s from my parent (2 or 3) out to the CA – this helps me analyze multiple CAs in a TG. Headers: 46 Chromosome bars (rows to separate data); TG bars (that summarize the Chr, Start and End of each TG and the CA) – sometimes there are multiple bars – I highlight the most likely. Main sort: by Side, Chr, Start (this will arrange all Shared Segments into their respective TGs – which should have one Ancestral line)

TG SUMMARY – Chr, Start, End, TGID, Side, columns for 8 generation of Ahnentafel #; Cousinship, CA Surnames; NO Matches. This is a summary subset of the TG MASTER – except I fill in only the Ahnentafel # for known CAs out to most likely distant CA. In italics, add in Ahnentafel #s from Cluster analysis compared to known TGs – this often extends the evidence in the TG (this is an experimental spreadsheet at this point. Sort: Side, Chr, Start .For me, this is a handy 2-page crib sheet.

WALK THE CLUSTERS BACK – a fairly technical tool. Start with a download of Excel data for Clusters based on a 50cM threshold (from DNAGEDcom Client). This will include Match name, cM and any Notes you’ve entered for each Match – this Note info is very valuable to have in this WTCB spreadsheet. Add columns for Ahnen (or CA Surnames) and a TG or Cluster (CL) code and Remarks. Finally add a column for serial # of each row (1 to how many rows you have at that threshold – so after a sort, you can reconstruct the original Cluster groups – just type a 1 at the top and drag it down in a series) – call this column CL50. And add another column – called CL# – and add in the Cluster # for each Match (I wish DGC would include this in the download spreadsheet. Then the work is to determine the Ahnentafal/CA and/or TG CL ID for as many Clusters as possible (hopefully your Notes will show you all the info you’ve collected about each Match). Add a summary row for each Cluster (using 0.4 in the serial number column – now when you sort on CL# and CL50, all the Clusters will be grouped with a header. IF there appears to be a consensus for the Ahnentafel/Surname and/or the TG/CL columns, enter that in this header row. Next, rerun the Cluster report with 45cM threshold – add two new columns for serial # in a new CL45 column and the Cluster # in the new CL# column. As before, add in a header row for each Cluster with 0.4 in the CL45 column and the Cluster # in the CL# column. Now add this spreadsheet to the CL50 spreadsheet, sort on Match name, and combine duplicate Matches onto one row (Matches in both CL50 and CL45 runs will have two Cluster #s and two serial #s – don’t worry. Resort on CL# and CL45 to get all the Matches in Cluster order again, with the added info from CL 50. Again, analyze each Cluster with a goal of finding the CA and/or TG/CL for most Clusters (for the Cluster header rows. If advantageous to see where a new Cluster is going, make a duplicate copy of Match rows which have strong affinity for other Clusters (and code it with the other Cluster number) – use to help identify CA for new Clusters. This is very much a judgment call, which will be confirmed or refuted in follow-on Cluster runs. Drop the cM threshold by 5cM and repeat. The number of Matches begins to increase dramatically – it’s a lot of work. But the benefit is that you are imputing Ancestral lines to many Matches who are Private or have little/no Tree. If you add the imputed into to the Notes of these Matches, they will show up in Shared Match lists and “flavor” them with an Ancestral line. Again – this process is experimental and requires us to use judgment. Future investigation – the Clusters from different companies should be roughly the same – it would be great to be able to link Ancestry Clusters (with many MRCAs) with Clusters from 23andMe, FTDNA, MyHeritage and GEDmatch (with TGs)…

Apologies – this WTCB “short” summary got a lot longer than I originally intended. I’ll have to post a more complete version later. The takeaway is: gradually reduce the cM threshold of Cluster runs and trace the Ancestry from the initial grandparents on out the ancestral lines, using new, smaller Matches which are often more distant cousins with more distant MRCAs. Think of a time-lapse movie of a plant growing, with new limbs branching out over time. If (when) we see a Match with an MRCA which is clearly out of whack with the “history” of the Cluster, it’s time to see if that Match would better be relocated to a different Cluster (per the gray cells) or a different MRCA needs to be found. It is OK to move a Match to a more probable Cluster if it has a lot of Shared Matches with that Cluster, too. We can use our judgment…

[35B] Segment-ology: Genetic Genealogy Spreadsheets; by Jim Bartlett 20211207