There has been some amount of discussion about segment size, triangulation, and the number of cousins who can share a Triangulated Group. The discussion often uses terms like extremely rare, small segments, distant ancestors, etc. without using specific examples. The arguments go from it’s OK to triangulate with close relatives, to it’s virtually impossible with distant relatives – and there is no discussion of any middle ground. The odds do diminish as you go back in ancestry, but there is no artificial dividing line: closer works, distant doesn’t work. There are always a gradation – shades of gray, if you will. Let’s see if we can put boundaries on it.
In my mind, one way to try to see the forest, and the trees, is to really take a look at an average genome (23 chromosomes, 3 billion base pairs), and see what kind of segments we might see at each generational level. Most of us know that we get pretty large segments from our grandparents, and the size drops down with each generation as we work our way back/up our ancestry. So let’s develop a table and take it back and see what we have.
The average number of crossovers per generation is 34. Yes, the average for males (fathers) is 27, and the average for females (mothers) is 41 (per www.isogg.org/wiki/Recombination ). But this difference (with respect to the total number of crossovers in a genome) fades after just a few generations – so we’ll use the average, 34.
Crossover Points in One Generation
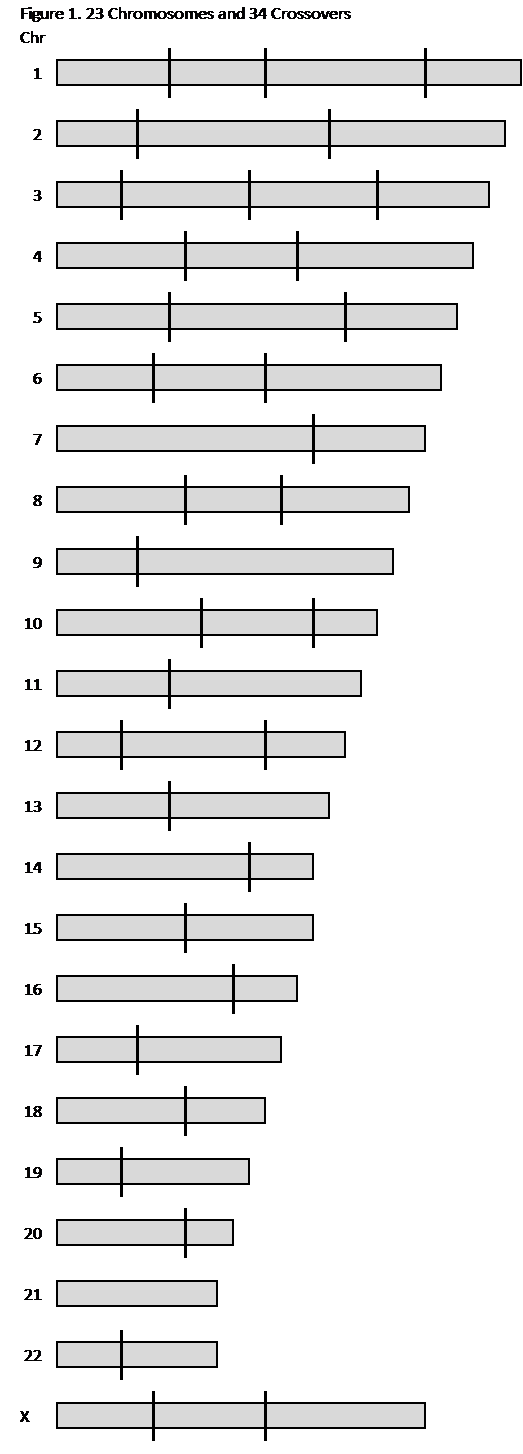
Let’s start with a parent and 23 pairs of chromosomes. In passing a genome to a child, this parent adds 34 crossovers, which results in 23+34 = 57 segments. Here is Figure 1 showing 34 crossovers and the 57 segments in one genome:

These are generally large segments from the grandparents. On average, these segments will be 3,400 cM divided by 57 segments or about 60cM per segment. But clearly some are larger and some are smaller. Sometimes a chromosome is passed intact – see Chr 21 above. You can try this at home, on a sheet of paper – just make 23 horizontal lines and put 34 vertical tic marks on them. You can put a few more or less tic marks, but the overall picture of relatively large segments from your grandparents will be the same.
The important observation here is that you have these ancestral segments on your chromosomes – they are fixed between fixed crossover points created when your parent passed these chromosomes to you. Of course you don’t know where they are at first, but as you determine Triangulated Groups (TGs) with various cousins, you’ll find that none of the shared segments span across one of these crossover points. And in fact, with enough shared segments you will start to see these crossover points firm up, with separate TGs (from the other grandparent) on either side of them. This chromosome mapping, with shared segments, identifies the crossover points for your ancestral segments. The shared segments with Matches usually only overlap part of your ancestral segment from a Common Ancestor – in this case a grandparent.
Crossover Points in Two Generations
Adding 34 tic marks per generation is a good exercise to carry out for several generations and get the feel for how this works. Let’s try another 34 vertical tic marks. We’ll add the tic marks to show the crossover points that were formed when grandparents passed the chromosomes (which they got from their parents) down to your parents. In effect this takes the 57 segments we had in Figure 1, and (with 34 more crossovers) creates 91 total segments as shown in the genome in Figure 2:

We still have fairly large segments. On average now, these ancestral segments are 3,400/91 = about 37cM per segment. Again – some will be larger, some smaller. Each of these segments in Figure 2 (between tic marks – both old and new) are from a great grandparent. These segments fill up each and every chromosome in this genome. You may note that some of the grandparent segments were not subdivided. This is not unusual. In fact it has to happen. We started with 57 ancestral segments and added 34 new tic marks (crossover points) – so 34 segments got subdivided and 23 segments did not.
Crossover Points for 13 Generations
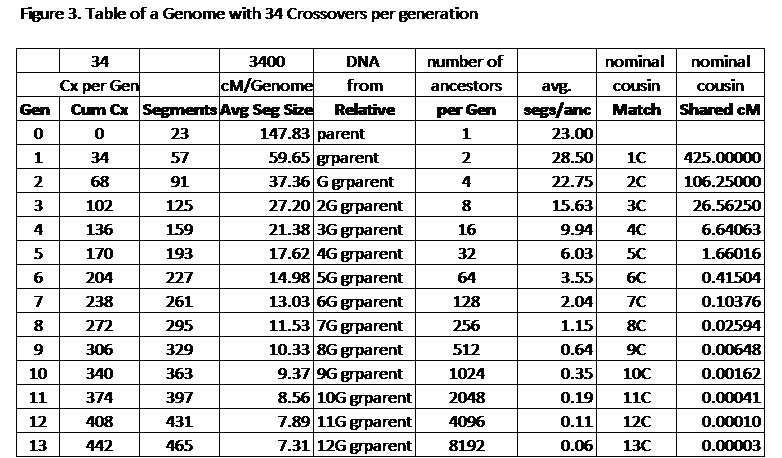
In the next generation back, we would add 34 more new tic marks (crossovers) which would subdivide only 34 of the 91 ancestral segments creating a total of 125 ancestral segments from 2G grandparents, and leaving 57 segments untouched (no subdivision). Here is a table in Figure 3 carrying this math out for 13 generations:

Discussion of Figure 3:
Note: This is a table with various values, depending on which generation you are focused on. So successively, pretend you are at a particular generation and read across to see the statistics. Cousins are abbreviated: 2nd cousin is 2C; 2nd cousin once removed is 2C1R.
– Gen 0: You have 23 chromosomes from a parent (we are only working on one genome, so the number of ancestors is 1. Your parent gave you 23 very large segments (which are chromosomes)
– Gen 1: You get DNA contributions from your 2 grandparents. This is in 57 segments spread over one genome. At this level of your ancestry you would see Matches with 1Cs. Review this in Figure 1.
– Gen 2: You get DNA contributions from your 4 Great grandparents on one side. Now you have 91 ancestral segments spread over 23 chromosomes, and each segment averages about 37cM. Some of these ancestral segments are larger, and some are smaller; and they all add up to 23 complete chromosomes (one full genome). This is the generation that you usually share with 2Cs – review Figure 2. In Figure 3 I also show the calculated shared segment values for the various cousins. With a 2C, you would normally share a total of 106cM (from one side). But the average size of the segments from the Great grandparents is only 37cM. This reflects the fact that you will probably share multiple segments with a 2C – perhaps on average three 37cM segments totaling 111cM… Remember these are averages and in actual practice there is a LOT of variation.
-Gen 3: This shows an average ancestral segment size of 27cM from your 2G grandparents – spread over 125 total segments. The total shared segment for a particular 3C is about 27cM – so you might expect a single segment from a 3C (again, this is just an average, but it might reflect what you often see). I’ve underlined ancestral segment (what you actually got from an ancestor), and shared segment which is the overlap between you and a Match. This overlap is rarely exactly the same ancestral segment in both you and your Match – one or both of you probably has somewhat more in the full segment you got from the Common Ancestor.
NB: this overlapping (shared) segment vs ancestral segment difference may be the root cause of some math calculations which have been touted as proving that exact matches among more than 3C are very rare. Several cousins having the exact same ancestral segment may be fairly rare, but experience with Triangulated Groups shows that overlaps are not that rare.
-Gen 4: Ancestral segments (averaging 21 cM) from your 16 3G grandparents are spread over about 159 segments. So you would see, on average, an ancestral segment from each 3G grandparent in roughly different 10 segments spread over the chromosomes in that genome. Most of your Matches would be 4C (or 3C1R or 4C1R). The shared segments would average 6.6cM, but another way to look at this is that roughly half of them would be over 7cM. However, experience shows that a relatively small percentage of our Matches are 4C and closer relatives. So there are not many such Matches to cover all the segments in our genome.
-Gen 5: Our 32 4G grandparents still give us fairly large 17cM ancestral segments (on average) spread out over 193 segments. We would still see most of our 4G grandparents in multiple segments. Our 5C Matches only share, on average, 1.7cM. So only some of them, on the tails of the distribution curves, will share 7cM or more. The offset is that we have so many 5Cs, that we still get plenty of IBD matches with them. However, the key point here is that while we may have a 17cM ancestral segment from a 4G grandparent, a 5C is only likely to share part of that with us. It would take several 5Cs, each with a 7-10cM segment, partially overlapping our own ancestral segment, to “cover” our 17cM ancestral segment. In practice we often get 5C Matches with above average segments, but usually not as large as 17cM.
-Gen 6: Our 64 5G grandparents pass down ancestral segments to us that average about 15cM. They pass these down to an average of 227 segments; and each 5G grandparent will pass down DNA to 3 or 4 different segments, on average. Perhaps some of our 5G grandparents won’t have DNA that reaches us at all, while others my pass down 5 or more segments – roughly, it usually averages out. At this level most of our Matches will be 6C, give or take a little. A 6C, on average, only shares 0.4cM of DNA with us. But there are long tails on these distribution curves, AND we have a LOT of 6Cs. The result is that we do have many 6C who do share IBD segments with us over 7cM. Yes, the probability of a specific 6C shared segment is one forth the probability of a 5C, but we have so many more 6C than 5C, we actually get more Matches with 6C. This means more 6C Matches are out there with a shared segment over 7cM, than there are for 5C. Again, it will normally take several of them to “cover” and ancestral segment (a TG).
-Gen 8: Skipping a generation to the 256 7G grandparents. At this point there are an average of 295 segments, or about one segment per 7G grandparent. Clearly by this time some of the 7G grandparents do not contribute to your DNA, and some 7G grandparents contribute to several ancestral segments. Your ancestral segments are in the 11-12cM range, on average. And despite the fact that 8Cs only share a small amount of DNA on average, there will still be many 8C with shared segments above a 7cM threshold.
Summary
All through this analysis, the number of ancestral segments has increased by a constant 34 with each generation; the average segment size starts off large and decreases with each generation, but even after 13 generation, the average ancestral segment is still over 7cM; the number of ancestors continues to double with each generation (and at some point duplicates will start to appear, but as I’ve outlined in Endogamy I and II, each duplicate really acts like a separate ancestor); and the average size of shared segments decreases by a factor of 4 with each generation, but we still see many Matches with shared segments over 7cM. To expand on this last point, I have over 10,400 “phased” Matches at AncestryDNA, with all the pile-ups and IBS already culled out. About 400 of these Matches are 4C or closer, leaving over 10,000 Matches in the 5C or more distant range. The distribution of these is spread out among 5C, 6C, 7C, 8C, etc. It is, so far, unclear how far back these go, but clearly there are many in the 5C-8C range. And AncestryDNA claims their “phasing” program has less than a 1% error rate. So 99% of these are IBD shared segments, probably most in the 6C-to-8C range. To my thinking, this means most of them must line up somewhere on our chromosomes. If we assume half, or 5,000, of these Matches are for each genome, on average, then these 5,000 Matches must be on 300 to 400 of my ancestral segments – or over 10 Matches in the 5C-8C range on every segment, on average. Some ancestral segments (TGs) may have more, some may have less, but the 5,000 IBD Matches have to go somewhere. I’ve picked on AncestryDNA here, because they poo-poo Triangulation (I think they don’t really understand it), and because they have equations that some have used to argue that we cannot have multiple 4C or above in TGs. But the same analysis is true using 23andMe and FTDNA data – they each report many Matches, they each claim a small IBS rate (under 5%), and by their own estimates, most of our Matches are beyond 4C. All of these IBD Matches have to be on our chromosomes somewhere. And, in 14 months (by my estimation), we will have twice as many Matches as we have now – we’ll have over 20 Matches per ancestral segment (TG)!
NOTE: the number of crossovers per generation will average out. So the number of segments created by each generation is fairly accurate – there is much less variation in these numbers than you might find in the average cM for an ancestral segment (which has a somewhat wider range) or a shared segment (which appears to have a much wider range).
“the main thing is to keep the main thing the main thing”
- Your genome (chromosomes) is divided into segments by crossover points.
- These are your ancestral segments, and each one is from a specific ancestor.
- Each Match will have his/her own crossover points and ancestral segments from specific ancestors.
- When you share an IBD segment with a Match this segment comes from a Common Ancestor (CA).
- A shared segment means your ancestral segment and your Match’s ancestral segment overlap.
- Your Match may have a small ancestral segment, which falls within your ancestral segment; a large ancestral segment, which includes your ancestral segment; or, usually, any size ancestral segment which overlaps a portion of your ancestral segment.
- The overlapping amount may be relatively small (say 7cM), or as large as your ancestral segment.
- The odds are very small that you and a Match would get exactly the same segment from a CA. And certainly the odds would be extremely small that you and several Matches would get exactly the same ancestral segment from a Common Ancestor.
- However, from the numbers of IBD shared segments we are getting from Matches, compared to the number of ancestral segments, it is highly probable that multiple Matches can and do have ancestral segments which overlap your ancestral segments.
Note: A full Triangulated Group (TG) is equivalent to one of your ancestral segments. Which ancestral segment the TG represents depends on the shared (overlapping) segments you have with your Matches. Several Matches with overlapping segments in a TG will tend to “wall paper” your ancestral segment – with enough of the right Match/segments your TG will cover the whole ancestral segment. Some TGs may be from a closer ancestor (say a great grandparent), some may be somewhat more distant (say a 7G grandparent). From my experience, most TGs will be in the 10-40cM range. This does create a hodge-podge effect (with TGs from different generations), but the TGs tend to be adjacent to each other from one end of each chromosome to the other. Alternatively, you can try to map to a specific generation – perhaps starting with grandparents (and determine those crossovers), and then determine which of those segments are subdivided into smaller segments from the great grandparents, and which segments remain intact going back that one generation. And then continue in this fashion with each additional generation. The drawback to this process is that you need many close relatives to take DNA tests to determine all the crossover points at each generation.
A final word of caution: don’t get too lost in the details or the math. Generally, you will have many Matches and IBD segments. Because they are IBD segments, they have to go somewhere on Mom’s side or Dad’s side. 23andMe and FTDNA have developed algorithms to help insure that most of your Match segments over 7cM are IBD, and from experience we know that almost all of the shared segments over 10cM are IBD, and well over half of the 7-10cM segments are IBD. So if you are reading this blog, you are probably into utilizing segments, along with your genealogy, to improve your family Tree. You should also upload to GEDmatch to find other Matches (from all 3 testing companies) with segments. When segments over 7cM Triangulate, it’s a very strong indication that those segments are IBD and the resulting TGs are from a Common Ancestor. You have an ancestral segment at the location of each TG, and your Matches share part of that ancestral segment with you. Each ancestral segment (TG) came from one of your parents and one of your grandparents, etc. Match/segments in that TG have to come from a distant ancestor who is ancestral to that grandparent. There is no cutoff to this process. We cannot say that only our large ancestral segments are valid. All of our ancestral segments came from a specific ancestor. Our ancestral segments have their own ancestral “Tree”. You may be more confident about a TG including a first or second cousin, but you probably don’t have enough tested cousins to cover every TG over all of your chromosomes. That doesn’t mean these other TGs are not valid, it just means you don’t have a close cousin to validate it. You have to use the closest cousin you can find to validate each TG. Your ancestral segments are real! They are part of you, from your ancestors. And Matches who share those segments, also share their ancestry – no matter how far back the Common Ancestor is. Note from Figure 1 and 2 that segments from more distant ancestors are “nested” within larger segments from closer ancestors. So if you cannot determine the most distant Common Ancestor, look for the closer Common Ancestor who provided the larger ancestral segment.
05D Segment-ology: Crossovers by Generation by Jim Bartlett 21060201