In my last post I outlined two insights from analysis of my 8700 Matches at AncestryDNA with confirmed Common Ancestors (CAs): the number of Matches increases dramatically with each generation going back to the 6C level (where ThruLines ferrets out a lot of my cousins); and the average cMs flattens out in the mid-teens beyond the 4C level.
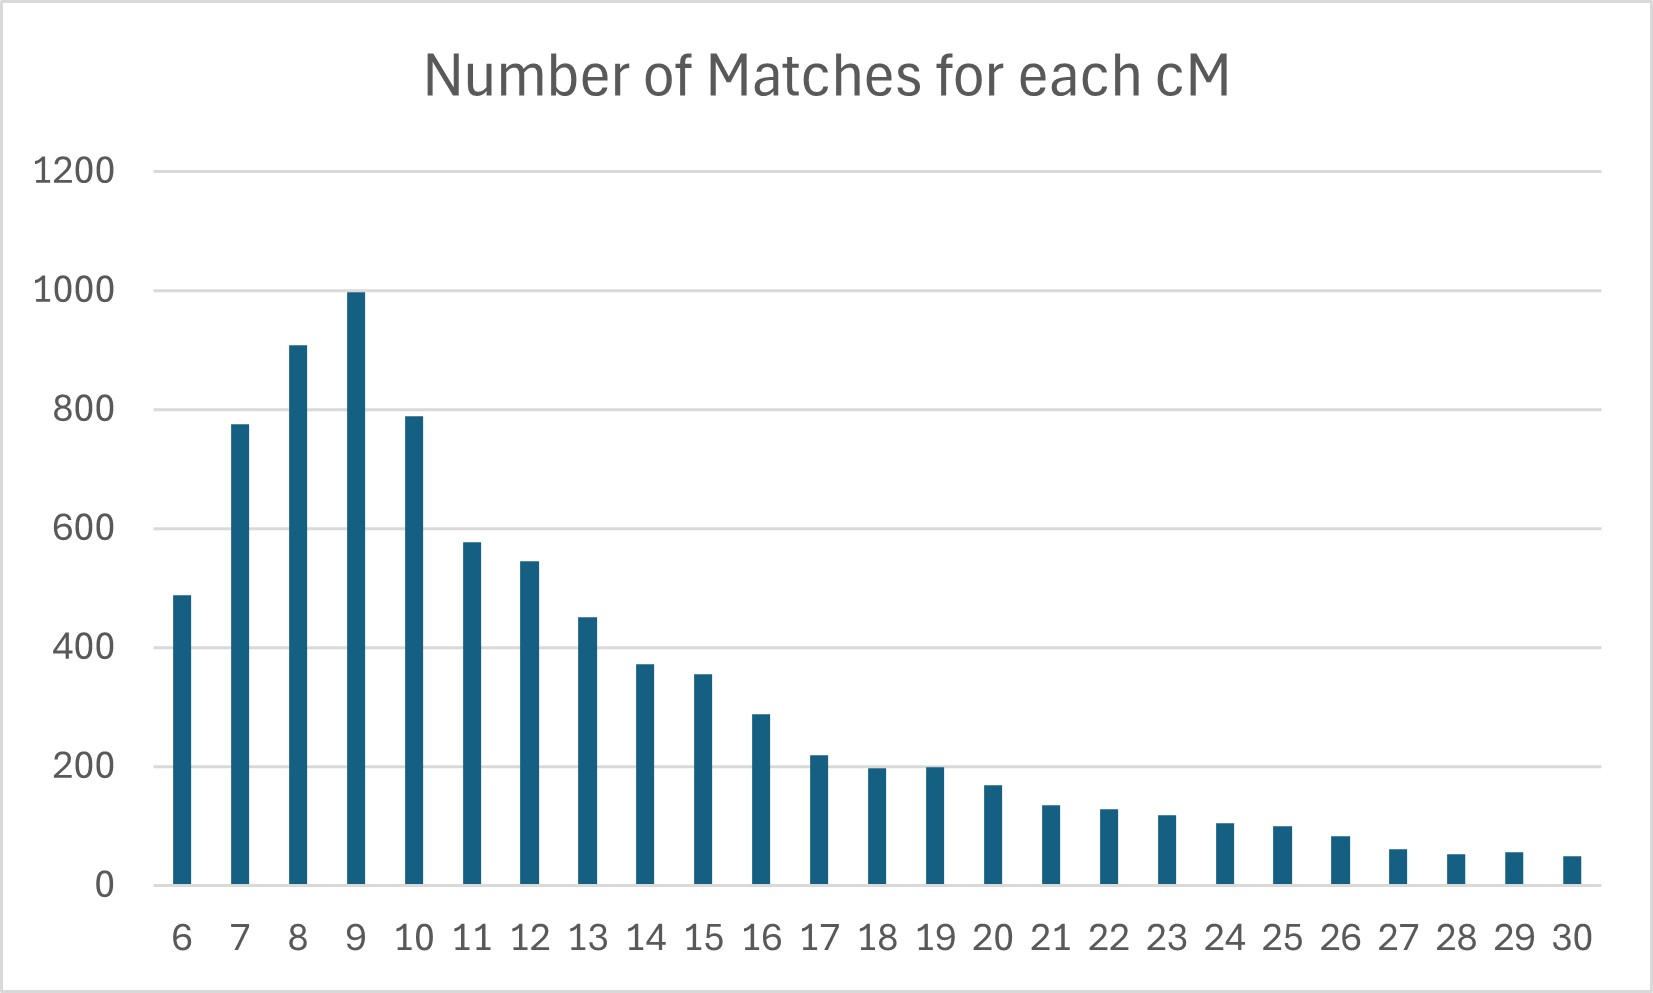
For this post I analyzed the Matches to see the distribution based on shared cMs.
Shown and not shown are 1491 Matches over 20cM, about 17% of the total. But the insight is that 83% of the Matches are from 6 to 20cM. And you can easily see the spike at 9cM. You’ll also notice the Matches at 6 and 7cM which I saved just before the AncestryDNA change in the lower threshold several years ago. I’m not sure there is a drop at 8cM – maybe because I haven’t found a lot of Matches at the 7C level and beyond.
At this point, as a life-long genealogist, I want to reiterate that cousins are where you find them and by far most are under 15cm (what we usually call small segments). And this is just the tip of the iceberg, because most of our true cousins beyond 4C (who have taken a DNA test) do not show up as DNA Matches. Most of my under-15cM Matches are also part of interrelated family groups (per ProTools), and their lines usually agree with standard genealogy research. A small percentage don’t and I remove them from the spreadsheet and this analysis.
Everyone has their own objectives in genetic genealogy. I encourage you to think about yours and write them down. Collecting cousins is not my objective but documenting interrelated cousins in family groups (with ProTools), and building evidence for each Ancestor is. This includes finding a few Ancestors that don’t “look” right and turn out to be NPEs. Or using Triangulated Groups or Clusters or Floating Branches to build evidence to break though Brick Walls/NPEs.
Clearly this is genealogy “big picture”. It forces me to treat all lines and Ancestors equally (yes, after I’ve spent a lot of time on my favorites). However, some of these insights, will also help with “targeted” objectives into specific areas of our genealogy.
[06H] Segment-ology: Insights into Matches; by Jim Bartlett 20260125
I now have over 8,700 Matches at AncestryDNA with a confirmed Common Ancestor (CA) with me between 2C and 8C. See my Common Ancestor Spreadsheet post here. That’s a lot of data, so I thought I’d do some analysis. In 2024 I posted (here) my averages for 3C to 8C which roughly agreed with the Shared cM project.
Below is a table summarizing all of my data (including full cousins, half cousins and removed cousins). For each relationship there are columns for the number of Matches, the average cMs, the lowest cM, the highest cM; plus the number of generations (meiosis events), and average cMs for each. The table is then repeated with a sort based on meiosis events.
A word about meiosis events. They are the count from me up to the CA and then back down to the Match. Like generations… A 1C is 4 events (two up to grandparent (the CA) plus two back down to the Match. The number of meiosis events with a 1C2R is 6 (two up and 4 down). A half relationship adds one to the meiosis events – eg a 4C1R is 11 events; and 4C1Rh is 12 events. These are important because in a mathematical simulation, each event reduces the cM by half. From the Shared DNA Project a 1C (4 events) average is 866cM compared to 2C1R (7 events) is 122cM which is roughly 866 halved three times. Remember, it’s an order of magnitude thing. And, as we shall see, it generally works for close relationships (like 1C and 2C), but drifts away for more distant relationships (like 4C and beyond). Important: this is not biology’s fault, it’s the math’s fault. It’s because we have a LOT of true distant cousins that do NOT share matching DNA with us; and they are not reflected in the averages. This (lack of a normal curve) is highlighted in the second sort (by meiosis numbers) below. This is also reflected in the DNA Painter Shared cM Project tool which shows different groups of Matches for a given input cM value. For example at DNA Painter, plug in 55cM… the 29% group of 3Ch, 3C1R, 2C3R and 2C2R half are all 9 meiosis events; and the second group of 4C, 3c1Rh, and 3C2R are all 10 meiosis events. This also demonstrates that by the time we get down to 3C and 4C levels there is a lot of overlap.
For this first table, the takeaway is that the number of Matches with CAs increased dramatically with each generation. [Note I combine full cousin with cousin 1R because at my age, most Matches will be a generation younger that me] 3C & 3C1R: 196 Matches; 4C & 4C1R: 662 Matches; 5C & 5C1R: 1,406 Matches; 6C & 6C1R: 3,426 Matches. WOW, what an increase in the number of Match cousins. And then we have 7C & 7C1R: 584 Matches; 8C & 8C1R: 363 Matches. What happened? Why the steep decrease in numbers. Well, IMO, the major factor is that AncestryDNA’s ThruLines quits at 6C – ThruLines can “see” into private Trees (I cannot); and it roots out MRCAs with the smallest of Trees (I don’t have that time). I can only dream of how many ThruLines I’d get at the 7C and 8C levels. Some of the ones I have now, were found/recorded when we had Circles at Ancestry.
The point is: there are LOTS of cousins still waiting to be determined. ProTools is helping.
Table 1: 8,799 AncestryDNA Matches Summarized by Relationship
AncestryDNA
cM
cM
cM
MRCA
#Matches
avg
low
high
meiosis
1C2Rh
3
138
78
200
7
2C
1
269
6
2C1R
14
127
34
220
7
2C2R
8
47
39
162
8
2C3R
2
34
22
140
9
3C
57
63
13
208
8
3Ch
5
20
16
95
9
3C1R
139
28
6
148
9
3C1Rh
26
28
7
111
10
3C2R
106
22
6
68
10
3C2Rh
20
20
6
92
11
3C3R
34
22
6
58
11
3C3Rh
12
23
8
40
12
3C4R
1
20
12
3C4Rh
2
10
8
12
13
4C
128
24
6
220
10
4Ch
7
12
6
19
11
4C1R
534
20
6
114
11
4C1Rh
33
16
6
30
12
4C2R
267
16
7
92
12
4C2Rh
12
12
6
39
13
4C3R
27
16
6
44
13
4C4R
1
17
17
17
14
5C
469
16
6
62
12
5Ch
29
17
6
27
14
5C1R
1137
14
6
60
13
5C1Rh
7
14
6
60
14
5C2R
300
14
6
41
14
5C2Rh
9
14
7
27
15
5C3R
75
14
6
40
15
5C3Rh
1
18
18
18
16
5C4R
2
10
10
10
16
6C
1922
12
6
56
14
6Ch
97
11
6
25
15
6C1R
1503
12
6
52
15
6C1Rh
58
10
6
22
16
6C2R
618
12
6
44
16
6C2Rh
47
12
6
29
17
6C3R
12
15
6
30
17
7C
262
13
6
41
16
7Ch
10
15
6
39
17
7C1R
322
12
6
43
17
7C1Rh
7
17
6
43
18
7C2R
17
16
6
25
18
7C3R
5
15
6
18
19
8C
310
12
6
35
18
8Ch
6
10
7
17
19
8C1R
53
16
6
37
19
8C2R
12
17
8
19
20
8C3R
7
10
6
13
21
9C
63
14
6
24
20
Total
8799
For the second table; the takeaway is that the average cM tracks pretty close to each other at the same meiosis numbers. And after meiosis level 9 which averages 27cM; the “curve” quickly “flatlines” in the mid teens. This is reflected at DNA Painter with many relationships all in play under 20cM.
Table 2: 8,799 AncestryDNA Matches Summarized by Meiosis Events
AncesttryDNA
cM
cM
cM
MRCA
#M
avg
low
high
meiosis
avg cM
2C
1
269
6
269
1C2Rh
3
138
78
200
7
2C1R
14
127
34
220
7
132
2C2R
8
47
39
162
8
3C
57
63
13
208
8
55
2C3R
2
34
22
140
9
3Ch
5
20
16
95
9
27
3C1R
139
28
6
148
9
3C1Rh
26
28
7
111
10
3C2R
106
22
6
68
10
25
4C
128
24
6
220
10
3C2Rh
20
20
6
92
11
3C3R
34
22
6
58
11
18
4Ch
7
12
6
19
11
4C1R
534
20
6
114
11
3C3Rh
12
23
8
40
12
3C4R
1
20
12
4C1Rh
33
16
6
30
12
18
4C2R
267
16
7
92
12
5C
469
16
6
62
12
3C4Rh
2
10
8
12
13
4C2Rh
12
12
6
39
13
13
5C1R
1137
14
6
60
13
4C3R
27
16
6
44
13
4C4R
1
17
17
17
14
5Ch
29
17
6
27
14
5C1Rh
7
14
6
60
14
15
5C2R
300
14
6
41
14
6C
1922
12
6
56
14
5C2Rh
9
14
7
27
15
5C3R
75
14
6
40
15
13
6Ch
97
11
6
25
15
6C1R
1503
12
6
52
15
5C3Rh
1
18
18
18
16
5C4R
2
10
10
10
16
13
6C1Rh
58
10
6
22
16
6C2R
618
12
6
44
16
7C
262
13
6
41
16
6C2Rh
47
12
6
29
17
6C3R
12
15
6
30
17
13
7Ch
10
15
6
39
17
7C1R
322
12
6
43
17
7C1Rh
7
17
6
43
18
7C2R
17
16
6
25
18
15
8C
310
12
6
35
18
7C3R
5
15
6
18
19
8Ch
6
10
7
17
19
13
8C1R
53
16
6
37
19
8C2R
12
17
8
19
20
15
9C
63
14
6
24
20
8C3R
7
10
6
13
21
Total
8799
Sidebar – this evaluation also acts as a Quality Control indicator. Watch for data points way outside the norms. I had three Matches who skewed one of the numbers. I went back to them – they were close to each other and I was sure they were from an NPE. Upon reevaluation, they needed to be a generation closer to our CA. I made the shift, and all the numbers fell back into the norm.
These insights are helping me with a new review of Walking The Clusters Back, where in I need to use judgment when imputing relationships and CAs.
[06G] Segment-ology: Insights into cM Patterns; by Jim Bartlett 20260122