Unknown's avatar

About Jim Bartlett

I've been a genealogist since 1974; and started my first Y-DNA surname project in 2002. Autosomal DNA is a powerful tool, and I encourage all genealogists to take a DNA test.

Insights into Matches

Featured

In my last post I outlined two insights from analysis of my 8700 Matches at AncestryDNA with confirmed Common Ancestors (CAs): the number of Matches increases dramatically with each generation going back to the 6C level (where ThruLines ferrets out a lot of my cousins); and the average cMs flattens out in the mid-teens beyond the 4C level.

For this post I analyzed the Matches to see the distribution based on shared cMs.

Shown and not shown are 1491 Matches over 20cM, about 17% of the total. But the insight is that 83% of the Matches are from 6 to 20cM. And you can easily see the spike at 9cM. You’ll also notice the Matches at 6 and 7cM which I saved just before the AncestryDNA change in the lower threshold several years ago. I’m not sure there is a drop at 8cM – maybe because I haven’t found a lot of Matches at the 7C level and beyond.

At this point, as a life-long genealogist, I want to reiterate that cousins are where you find them and by far most are under 15cm (what we usually call small segments). And this is just the tip of the iceberg, because most of our true cousins beyond 4C (who have taken a DNA test) do not show up as DNA Matches. Most of my under-15cM Matches are also part of interrelated family groups (per ProTools), and their lines usually agree with standard genealogy research. A small percentage don’t and I remove them from the spreadsheet and this analysis.

Everyone has their own objectives in genetic genealogy. I encourage you to think about yours and write them down. Collecting cousins is not my objective but documenting interrelated cousins in family groups (with ProTools), and building evidence for each Ancestor is. This includes finding a few Ancestors that don’t “look” right and turn out to be NPEs. Or using Triangulated Groups or Clusters or Floating Branches to build evidence to break though Brick Walls/NPEs.

Clearly this is genealogy “big picture”. It forces me to treat all lines and Ancestors equally (yes, after I’ve spent a lot of time on my favorites). However, some of these insights, will also help with “targeted” objectives into specific areas of our genealogy.

[06H] Segment-ology: Insights into Matches; by Jim Bartlett 20260125

Insights into cM Patterns

Featured

I now have over 8,700 Matches at AncestryDNA with a confirmed Common Ancestor (CA) with me between 2C and 8C. See my Common Ancestor Spreadsheet post here. That’s a lot of data, so I thought I’d do some analysis. In 2024 I posted (here) my averages for 3C to 8C which roughly agreed with the Shared cM project.

Below is a table summarizing all of my data (including full cousins, half cousins and removed cousins). For each relationship there are columns for the number of Matches, the average cMs, the lowest cM, the highest cM; plus the number of generations (meiosis events), and average cMs for each. The table is then repeated with a sort based on meiosis events.

A word about meiosis events. They are the count from me up to the CA and then back down to the Match. Like generations… A 1C is 4 events (two up to grandparent (the CA) plus two back down to the Match. The number of meiosis events with a 1C2R is 6 (two up and 4 down). A half relationship adds one to the meiosis events – eg a 4C1R is 11 events; and 4C1Rh is 12 events. These are important because in a mathematical simulation, each event reduces the cM by half. From the Shared DNA Project a 1C (4 events) average is 866cM compared to 2C1R (7 events) is 122cM which is roughly 866 halved three times. Remember, it’s an order of magnitude thing. And, as we shall see, it generally works for close relationships (like 1C and 2C), but drifts away for more distant relationships (like 4C and beyond). Important: this is not biology’s fault, it’s the math’s fault. It’s because we have a LOT of true distant cousins that do NOT share matching DNA with us; and they are not reflected in the averages. This (lack of a normal curve) is highlighted in the second sort (by meiosis numbers) below. This is also reflected in the DNA Painter Shared cM Project tool which shows different groups of Matches for a given input cM value. For example at DNA Painter, plug in 55cM… the 29% group of 3Ch, 3C1R, 2C3R and 2C2R half are all 9 meiosis events; and the second group of 4C, 3c1Rh, and 3C2R are all 10 meiosis events. This also demonstrates that by the time we get down to 3C and 4C levels there is a lot of overlap.

For this first table, the takeaway is that the number of Matches with CAs increased dramatically with each generation. [Note I combine full cousin with cousin 1R because at my age, most Matches will be a generation younger that me] 3C & 3C1R: 196 Matches; 4C & 4C1R: 662 Matches; 5C & 5C1R: 1,406 Matches; 6C & 6C1R: 3,426 Matches. WOW, what an increase in the number of Match cousins. And then we have 7C & 7C1R: 584 Matches; 8C & 8C1R: 363 Matches. What happened? Why the steep decrease in numbers. Well, IMO, the major factor is that AncestryDNA’s ThruLines quits at 6C – ThruLines can “see” into private Trees (I cannot); and it roots out MRCAs with the smallest of Trees (I don’t have that time). I can only dream of how many ThruLines I’d get at the 7C and 8C levels. Some of the ones I have now, were found/recorded when we had Circles at Ancestry.

The point is: there are LOTS of cousins still waiting to be determined. ProTools is helping.

Table 1: 8,799 AncestryDNA Matches Summarized by Relationship

AncestryDNAcMcMcM  
MRCA#Matchesavglowhighmeiosis
1C2Rh3138782007
2C12696
2C1R14127342207
2C2R847391628
2C3R234221409
3C5763132088
3Ch52016959
3C1R1392861489
3C1Rh2628711110
3C2R1062266810
3C2Rh202069211
3C3R342265811
3C3Rh122384012
3C4R12012
3C4Rh21081213
4C12824622010
4Ch71261911
4C1R53420611411
4C1Rh331663012
4C2R2671679212
4C2Rh121263913
4C3R271664413
4C4R117171714
5C4691666212
5Ch291762714
5C1R11371466013
5C1Rh71466014
5C2R3001464114
5C2Rh91472715
5C3R751464015
5C3Rh118181816
5C4R210101016
6C19221265614
6Ch971162515
6C1R15031265215
6C1Rh581062216
6C2R6181264416
6C2Rh471262917
6C3R121563017
7C2621364116
7Ch101563917
7C1R3221264317
7C1Rh71764318
7C2R171662518
7C3R51561819
8C3101263518
8Ch61071719
8C1R531663719
8C2R121781920
8C3R71061321
9C631462420
Total8799     

For the second table; the takeaway is that the average cM tracks pretty close to each other at the same meiosis numbers. And after meiosis level 9 which averages 27cM; the “curve” quickly “flatlines” in the mid teens. This is reflected at DNA Painter with many relationships all in play under 20cM.

Table 2: 8,799 AncestryDNA Matches Summarized by Meiosis Events

AncesttryDNAcMcMcM    
MRCA#Mavglowhighmeiosisavg cM
2C12696269
1C2Rh3138782007 
2C1R14127342207132
2C2R847391628 
3C576313208855
2C3R234221409 
3Ch5201695927
3C1R1392861489 
3C1Rh2628711110 
3C2R106226681025
4C12824622010 
3C2Rh202069211 
3C3R34226581118
4Ch71261911 
4C1R53420611411 
3C3Rh122384012 
3C4R12012 
4C1Rh33166301218
4C2R2671679212 
5C4691666212 
3C4Rh21081213 
4C2Rh12126391313
5C1R11371466013 
4C3R271664413 
4C4R117171714 
5Ch291762714 
5C1Rh7146601415
5C2R3001464114 
6C19221265614 
5C2Rh91472715 
5C3R75146401513
6Ch971162515 
6C1R15031265215 
5C3Rh118181816 
5C4R21010101613
6C1Rh581062216 
6C2R6181264416 
7C2621364116 
6C2Rh471262917 
6C3R12156301713
7Ch101563917 
7C1R3221264317 
7C1Rh71764318 
7C2R17166251815
8C3101263518 
7C3R51561819 
8Ch6107171913
8C1R531663719 
8C2R12178192015
9C631462420 
8C3R71061321 
Total8799       

Sidebar – this evaluation also acts as a Quality Control indicator. Watch for data points way outside the norms. I had three Matches who skewed one of the numbers. I went back to them – they were close to each other and I was sure they were from an NPE. Upon reevaluation, they needed to be a generation closer to our CA. I made the shift, and all the numbers fell back into the norm.

These insights are helping me with a new review of Walking The Clusters Back, where in I need to use judgment when imputing relationships and CAs.

[06G] Segment-ology: Insights into cM Patterns; by Jim Bartlett 20260122

How Old Are Your Segments?

Featured

Well, it depends… Your chromosomes are very large segments, which are not very old at all.  On the other hand, I have some small DNA segments from Neanderthal Ancestors – pretty old. In general, the smaller the segment, the older it is. But let’s think about this for a moment.

 This discussion will be about your DNA segments – large segments from close relatives to ever smaller segments from more and more distant relatives. They are all part of the DNA you inherited from your Ancestors. Segments are formed at the moment of conception – when sperm meets egg – about nine months before you were born. They don’t change until you pass them on – after recombination and new crossovers – to the next generation. So our unit of “age” measurement is a generation.

So, let’s start with the largest “segments” – your 44 autosomes passed to you by your parents. How old are these 44 chrsomosomes? Well, they are 0 generations old. You are the first person to ever have each of these specific – full chromosome – segments.*

Then let’s look at your grandparent segments that make up your chromosomes. On average you have 22 chromosomes, subdivided by 34 crossovers, for 56 grandparent segments per Side. These were each part of full, new, chromosomes passed from your grandparents to your parents; and then, one generation later, passed to you by a parent – they are 1 generation old. Again, due to random recombination for every child, you are the first person to ever have these specific segments.*

Similarly, your great grandparents, passed new chromosomes to your grandparents, who passed segments to your parents who passed segments to you, which would be unique and 2 generations old.*

You get the picture. The unique segments in each of your Ancestors are recombined into new segments and passed down – generation after generation. Your segments are “imbedded” in the chromosomes and large segments they passed down. And knowing the genealogy of each segment, we can count the generations to find their age – always one less than the number of Ancestor generations back.*

* So what’s with that pesky asterisk? In short, “sticky” segments. Some segments are passed down intact – they are exactly the same segment in an Ancestor and their child (who is also your Ancestor) – they were not subjected to a recombination crossover. More likely than not, one of your smaller chromosomes (Chr 18 to 22) was passed from a parent to you intact. So, in that particular case, it’s age is 1 generation (not 0 generations like all the other chromosomes). And this happens to some of the other segments passed down at each generation. Above we noted that you got about 56 grandparent segments from one parent. When you pass these to your children, recombination will create about 34 new crossovers. In general, they will be subdivisions of 34 of the 56 grandparent segments passed down to you – leaving 22 grandparent segments intact. You only pass half of your DNA to each child, but that still includes about 11 grandparent segments which are now 2 generations old!

It gets complicated real quick!

This is one of the reasons that as segments get smaller, the range of possible relationships increases. A given segment may have persisted for several generations, or not.

Chromosome Mapping of segments with MRCAs let’s us figure this out. Even if our Map is not complete, at least in some areas of our chromosomes can be figured out. Someday… it will be interesting to try to determine a Shared cM Chart which figures in the age of the segment. I’ll bet the ranges would be somewhat smaller…

[O5H] Segment-ology: How Old Are Your Segments? by Jim Bartlett 20251218

Shared Segment Spreadsheet Incarnations

Featured

For me, the Shared Segment Spreadsheet is a critical tool, which evolves through four incarnations.

1. It starts as a collection of all your shared DNA segments – from each company. This also means a collection of all your Matches (except AncestryDNA), some with multiple shared segments. It can be searched and sorted.

2. Use as a segment Triangulation tool. Sort on: Company + Chromosome + Segment Start to arrange all the shared segments (within a company) into Chromosomes. And within a Chromosome they are arranged so that overlapping segments are close to each other.  With this “view” each segment is Triangulated with other overlapping segments, or not. Maternal and Paternal Triangulated groups are formed*. Some of the under-15cM segments will not Triangulate and are labeled “false” and deleted or moved out of this spreadsheet –  “everybody’s got to be somewhere.”  This process is repeated for each company.

3. Form/identify Triangulated Group (TG) segments. Sort on: Side + Chromosome + Segment Start to separate the maternal and paternal segments and sort them in order within each chromosome. Since this spreadsheet is comparing all these shared segments with your own DNA segments, the shared segments from different companies will “break” into TG segments that align with your own segments. However, this phase of the process requires some judgment – the data is a little fuzzy and the ends of TGs will not be precise. You have to make a call. In general, to align with your DNA segments, each TG will end at the same Mbp as the next one starts. Make those calls and assign a TG Identification (TG ID)** for each segment. Make a TG segment header row for each one (I have 372 TG segments) that lock in the overall TG start and end positions and TG ID. TIP: make the TG header start location 0.01Mbp less than the first shared segment in the TG – so it sorts on top of the individual segments. Remember that every Match in a TG is related to you on your line back to a specific Common Ancestor (CA). Note: some small segments in a TG may go back further.

4. Use these TG groups to do the genealogy! Among the Matches, find the consensus path to the CA.

Summary: A shared segment spreadsheet has several uses – collection > Triangulation > TG ID > genealogy. The TG segment is your DNA segment. This covers all of your genetic genealogy, but you can always focus on one or more individual TGs, if you don’t want to eat the whole elephant at one time.

*I’ve covered the Triangulation process in other blogposts, and won’t repeat that here – this blogpost is about the three incarnations of the spreadsheet.

**I’ve covered TG IDs in other blogposts

[35BBa] Segment-ology: Shared Segment Spreadsheet Incarnations by Jim Bartlett 20251102

Walk The Clusters Back with AncestryDNA

Featured

AncestryDNA has just rolled out enhancements to their Clustering Program that let you “Create custom clusters”. At AncestryDNA > DNA > Matches > By Clusters/Pro > Create custom clusters. You must have the additional subscription for ProTools to access this program.  I have not run it through its paces yet, but I wanted to review the Walk The Clusters Back (WTCB) concept, and ask for feedback on your experience with it.

The concept of WTCB is to adjust the cM range to focus on two generations at a time. The idea is to “solve” the Clusters for close relatives and then adjust the range down to include Matches in the next generation back, and then see where the Clusters separate into more distant Clusters. Start easy with a range of 90-400cM which is the recommendation for the LEEDS method to determine four groups. This would be roughly four Clusters with each one focused on a separate grandparent. Tag (by Dots or by Notes) every Match to the appropriate grandparent. Then drop the range to, say, 70-200cM to get mostly Clusters that include Matches who are 1C on a grandparent, and 2C on a Great grandparent. I don’t know of anyone who has found a “sweet-spot” range for each generation, and I suspect it might be different for each of us. The last time I did this WTCB I had to “fiddle” with the ranges – and never could find any range that gave me only Clusters with Matches from only two generations in each Cluster. So, get used to that.

The point is to notice when some Matches you’ve tagged to an Ancestor, then show up in different Clusters based on a new range – and then determine which sides are represented by the new clusters. Then tag all of those new Matches appropriately.  Example: you have a Cluster with 20 Matches that is focused on a Great grandparent.  Tag all the Matches with that grandparent (if not already tagged as a closer Ancestor). Adjust the range to add more Matches. Look in the new Clusters for the previously Tagged Matches – hopefully there are two new Clusters, but maybe three. From my experience there may be two Clusters with 15 to 25 Matches, each of which include some of the 20 Matches from the previous run. These new Clusters would represent the next generation back and the focus would only be one of the two parents of the previous Cluster.

Yes, it gets harder and harder with each new generation. The good news is that a Cluster with known Matches from one generation, can only morph into Clusters going back from that one Ancestor. This reduces the genealogy effort . If you’ve reviewed all of your ThurLines (and used ProTools to add even more Matches), you have likely tagged a lot of Matches out to 6C. So as the 4C and 5C and 6C Clusters start to form (as you reduce the cM range), you may already see the Ancestor for the new Clusters by looking at the Notes.

Use your judgment, and fiddle with the cM ranges. Please report back on your experience, and/or if you find a sweet spot for some range. Note that the sweet spot should include two generations – the one you’ve figured out and the next one you are working on.

[19P] Segment-ology: Walk The Clusters Back at AncestryDNA by Jim Bartlett 20251017

Boundaries of a Triangulated Segment Part 2

Featured

Thanks to all for your responses to my last blogpost. All of them are a good read.

I had always thought a TG segment was crystal clear… WRONG. Per the classic refrain from the Legal Genealogist, Judy Russell: “It depends!”  My second ever blogpost on 9 May 2015 (Benefits of Triangulation) stated 16 benefits, including: Organizing most Matches into TGs; All Matches in a TG have the same Common Ancestor; the TGs define crossovers and a Chromosome Map; TGs are equivalent to Phased data. What I didn’t say explicitly is that each TG represents a segment of my DNA.

The elephant in the room is: who was the first Ancestor to pass down that segment (as part of a full chromosome passed to a child who is my Ancestor)? In other words, in what earliest generation did that full segment first exist in my line? There may be a  different such “elephant”  for each Match… but that’s another story.  

So back to “it depends”…. For me there are 3 objectives:

1. “See” my DNA segments. Divide up my chromosomes into discrete segments, each one of which came from a specific Ancestor.

2. Determine the Ancestor for each segment.

3. Determine my Chromosome Map of segments – each segment being adjacent to another segment from the beginning to the end of each of my 45 chromosomes.

When I started forming Triangulated Groups, I only worked with known cousin Matches. It created a patchwork of TGs. One day I decided to bite the bullet and Triangulate all of my segments, a company at a time (FTDNA, 23andMe and MyHeritage).  It took months without many of the tools we have today. And the three versions meshed virtually exactly! That was as expected since all comparisons were against my DNA. I was using the “full” version of a TG, plus some judgment for large segments from close relatives that spanned more than one TG. This brings me to a significant factor in Triangulation: Judgment.

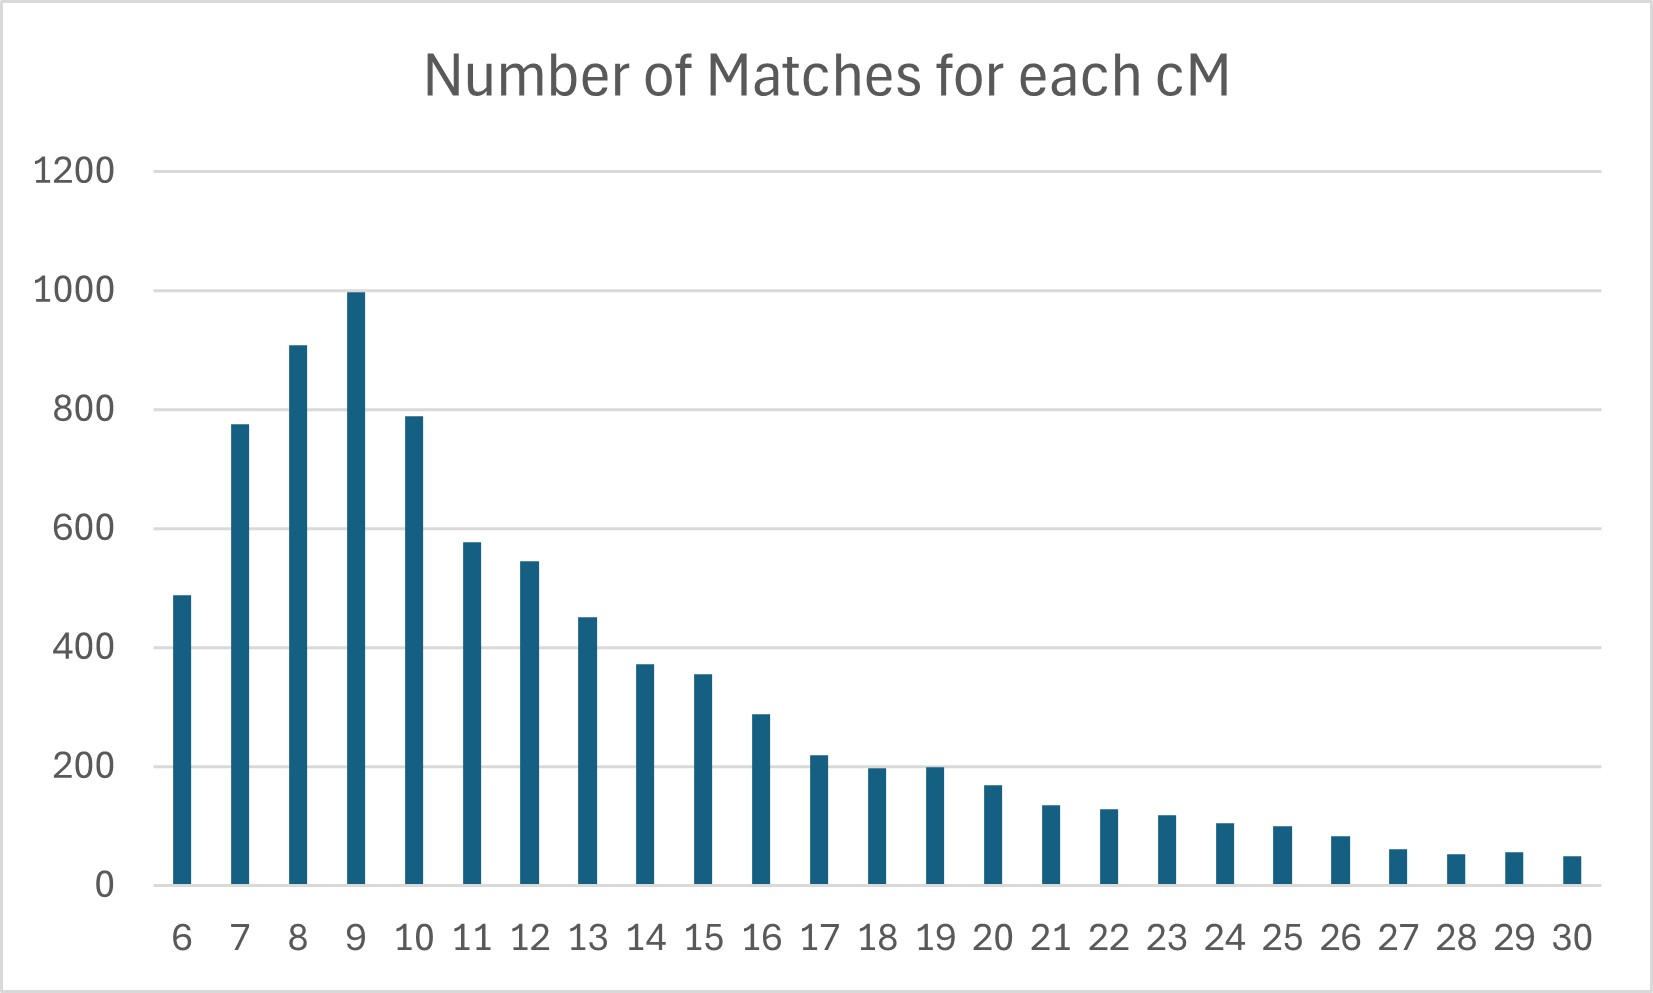
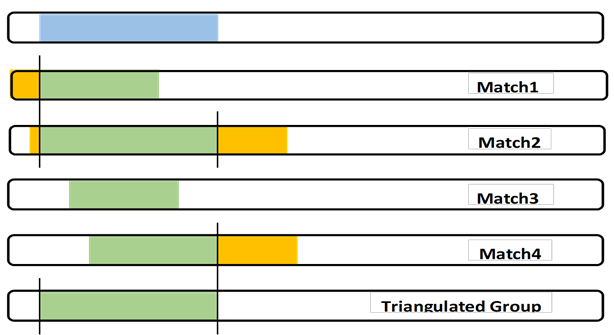
Judgment: It’s easy to compare yourself to another Match and “see” an exact shared DNA segment. But what would happen if Match 3 in the last blogpost only overlapped Match 1 by 5cM? Would we then call this a 5cM TG (against the rules and throw the whole thing out?). Would we discard Match 3 (even if they had a robust Tree that included a CA)?

Judgment: Sometimes there is a close relative, Match 5, who overlaps much more than me and Matches 2 and 4. Experience (and judgment) tells me that this somewhat larger segment is probably from a close relative whose Common Ancestor with me includes a father/mother more distant – with one of them being the CA for the full TG.  

As I read over the comments of the previous blogpost, several words pop into my mind: context, messy, complex, judgment, imprecise, etc., as well as “we’re making this up as we go”.

Messy – yes Triangulating all of our Match segments against our own can be messy – and judgment is needed. Given the random nature of recombination, I do see some curve balls from time to time. Triangulation usually identifies false (IBS) segments, which should be discarded. If I find a shared segment that really messes things up, I’ll also discard it (or at least highlight it as weird). As I’ve blogged before, the raw data is sometimes messy – or fuzzy – sometimes reporting a shared DNA segment that runs longer that it should. Although my parents are not related (per GedMatch), I do have one area of my DNA that my two parents combined have all of the most common SNPs, and so I get a “zigzag” pileup of many Matches with false segments there. I’ve identified this area and then toss out those Match segments (<10cM). Pedigree collapse and endogamy also create messy areas. To the extent possible, identify these specific locations with a dummy segment to highlight the potential issue.

Context – in developing my Chromosome Map, the segments will be adjacent to each other.  I look for the previous and the following TGs to the one I am working on. Ideally (and actually) each of my segments will “crossover” to the next segment which is from a different Ancestor of mine. Note – that “next” Ancestor may involve a different grandparent, or a different 3xG grandparent. We have to fill out the Chromosome map to figure that out, but it is important to remember that the next TG will have a different CA. So if I accept the conservative TG (a part of the Match 3 shared segment), what different Ancestor can I find for all of the “leftover” shared DNA segment pieces of my DNA.

Complex – One complex part of this analysis is what about the parts of true segments from Match 1 and 2 and 4 that are not in the full TG I show in blue? I focus on my DNA, but I think every true Segmentologist should try this experiment with say Match 2 at GEDmatch. Use Segment Search to find other Matches who share the same segment and build the TG for Match 2 – it “will” be different than my (or your) TG. A little different or a lot different? If Match 2 is a known cousin, the same MRCA would almost always apply. By doing this with other Matches in a TG, many of us (working together) are building a larger segment of the CA.

Imprecise – I’ve blogged about fuzzy data. I counter this with judgment. I look at all the segment data for a TG (all my segments are in one spreadsheet). Among the TG fuzzy start data I decide on a specific Mbp start location. Then I decide on a Mbp start location for the next (adjacent) TG. Often some shared segments from the initial TG will “spill over”, past the start of the next TG. The small amounts of spillover, I just ignore: fuzzy data. If there is a large spillover, I’ll consider if the second TG is potentially closely related to the first TG, or not.

Imprecise – This also describes the fact that all your shared DNA segments may not “cover” all of your DNA neatly, or uniformly, or even completely. The shared DNA segments are independent and random – they are not at our beck and call…  They don’t necessarily help us fill the gaps perfectly. They are what they are – they are clues we must use as best we can.

All of the above is to indicate that all IBD shared segments should have a home in a TG, and that all the TG segments should cover all of your chromosomes, IMO. Remember, at each generation, all of your segments from that generation must add up to all your chromosomes!

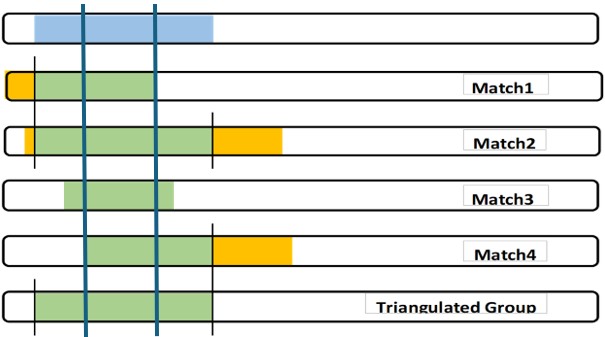
Another aspect of this which I muse about is the SNPs – thousands of them in a unique arrangement in my DNA. Let’s say Match 1 shares 2,000 SNPs with me. Alone we would say the shared DNA segment between us (green) came from a Common Ancestor. Similarly we would say the 3,000 SNPs in the shared segment with Match 2 was from a CA. I don’t see how we could argue that these two CAs were somehow different. I think it is much more likely that the CA is the same, and Match 1 just didn’t get the full segment that I did and Match 2 did. Match 3 is in the middle of all these SNPs – surely Match 3 got the same SNPs from the overlapping locations. By comparing the SNP values of all 4 Matches, I’m confident that we’d find the same values at each SNP location.

Note: all of these Matches and evaluations are based on separated cousins. Of course close relatives could have the same segments and SNPs – the whole concept of segment Triangulation depends on an analysis of more distant relationships.

My summary:

The TG Group of Matches should all look for the same Common Ancestor – and hopefully help each other toward that goal.

The full TG segment (blue) is my DNA segment, which I can use as part of my Chromosome Map. It defines my crossover points. Also I can contribute my SNPs to any larger study of my Ancestor’s DNA.

I must be careful to not state that my Matches have this TG segment. Matches will have their own different, but overlapping, TG segment.

The Common Ancestor almost certainly passed down a larger DNA segment, through at least some of their children, which different descendants (including some of my Matches) got. Note: there may be other descendants who have DNA tested who may share with the TG Matches, but not me (I am not the center of the universe…)

[08Ab] Segment-ology: Boundaries of a Triangulated Segment Part 2 by Jim Bartlett 20250915

Boundaries of a Triangulated Segment

Featured

I presented “More Segmentology” today at the East Coast Genetic Genealogy Conference. I was questioned on a slide grouping segments into a Triangulated Group, and it appears there is a debate about this. I’d like to have your input on this.  

Here is my slide:

I show 4 Matches with overlapping Shared Matches with me on one side (parent). This is the definition of a Triangulated Group, which I showed in the bottom Chromosome – in green. What we can “see” is only the Shared Segments from Matches 1 to 4 in green.  I contend that Matches will rarely have segments that are exactly the same as my segment. So for the purpose of illustration, I guessed that their segments from our Common Ancestor was almost always different – that sometimes their segments started to the left of mine, sometimes to the right of mine; and sometimes the same ending, and other possibilities shown. In fact, I have tested this at GEDmatch where I could Triangulate with each Match as the base, and sure enough, they had their own, different, Triangulated segment. I went on to claim that my segment (from our Common Ancestor) started where the Shared Segments had their earliest start; and ended where the Shared Segments had their latest end – as shown in the green Triangulated Group segment above. The start and end of the TG defined my segment. Some others contended that the Triangulated Group segment should be shown as only the green that was common to all 4 Matches – like the space between the two vertical blue lines.

I don’t know of any Scientific Paper that defines the boundaries of a Triangulated segment. So I am interested in your perspective, and why.

[08Aa] Segment-ology: Boundaries of a Triangulated Segment by Jim Bartlett 20250914

A New Cluster on the Block

Featured

AncestryDNA has rolled out an “auto” Cluster program. I tried it and got 8 Clusters, ranging from 3 to 9 Matches in each one. A total of 40 of my 60 Matches above 65cM. The other 20 Matches were not included because they didn’t form a Cluster of at least 3 Matches. I know the Common Ancestors for each of the 40 Matches and the program clustered them 100% correctly. I’d give AncestryDNA an A+ for this new program. I’m impressed and anxious to have the ability to adjust the cM ranges downward to get more Clusters.

Some additional input on auto-Clustering.

It began in late 2018, with Genetic Affairs (by EJ Blom), and soon we also had Shared Clustering (by Jonathan Brecher) and DNAGedcom Client (by Rob Warthen). I tried all three. I had already done segment Triangulation on all my Matches at FamilyTreeDNA, and I worked with Johathan Brecher and we Clustered those same Matches. There was over 90% concurrence between the hundreds of Clusters and the hundreds of Triangulated Groups. Not enough to say the two processes were equivalent (they are not), but certainly this analysis showed a strong tendency of Clusters to point to a Common Ancestor between me and all the Matches in each Cluster. A very strong clue in each case.

I then Clustered all of my Matches at AncestryDNA – down to about 18cM. Many of the Clusters had a Common Ancestor consensus (easily seen in the Match Notes I had previously entered – many from ThruLines). So, I imputed that Common Ancestor to the rest of the Matches in each Cluster. I used Ahnentafel numbers to represent my Ancestors and developed a tagging code: e.g. #A0020. The #A means a confirmed Common Ancestor with a Match, and 20 is Ahnentafel for William MITCHELL 1824-1895. This code is the first thing in the Notes field. When I impute a Common Ancestor to a Match from a Cluster consensus, I use #L0020 – which means the Match is highly Likely to have that Common Ancestor with me. With a #A or a #L, I tagged almost all my Ancestry Matches over 20cM and many below that. This was in the 2019-21 time frame.

Recently, with ProTools, I’ve been able to determine how many more Matches fit into my Tree – and thus our Common Ancestor. For well over 90% of all these new Match cousins, the #L tag turned out to be correct – I only needed to change the L to A.

Bottom line 1: I am a big fan of Clustering at AncestryDNA and really look forward to expanding the coverage to more Matches.

Bottom line 2: Use ProTools with Clustered Matches to really nail down Common Ancestors to Matches.

[22DI] Segment-ology: A New Cluster on the Block by Jim Bartlett 20250725

Segment Triangulation Insight

Featured

Your DNA segments are from your Ancestors. They are adjacent to each other and fill up (or “cover” or paint) each of your Chromosomes. You have shared DNA segments with your Matches. With a browser, you can see your shared DNA on a chromosome – visually as a bar and by the start and end points in the data. Segment Triangulation lets us group overlapping segments and identify your full segment from an Ancestor. It also places each Triangulated segment where it belongs on one of your 46 chromosomes. Genealogy helps you decide if each segment is on a maternal or paternal chromosome. Once you do that, it’s then relatively easy to “fit” the Triangulated segments along each chromosome.  

Three key elements of Segment Triangulation:

1. A browser to give you the data – where is each segment on a chromosome.

2. Determine the segments are on the same chromosome (you have two of each chromosome – one maternal and one paternal). Several ways to do this…

3. Determine where one of your segments stops and another starts – i.e. the crossover points. A judgment call based on the consensus of the data.

A fourth key element is determining the MRCA for the Triangulated segment, and the path the segment took from the MRCA down a line of your Ancestors to a parent to you. This is mainly a genealogy task, working with your Matches and their Trees to build a consensus.

I hope this “insight” provides a clearer picture of what Segment Triangulation is all about and why it is a worthwhile process – for specific segments or all of your DNA.

[08F] Segment-ology: Segment Triangulation Insight by Jim Bartlett 20250525

Half-Identical Region (HIR)

Featured

Your DNA segments (that make up the 23 Chromosomes passed down to you from a parent) are not the same as shared DNA segments with a Match (as described by a chromosome browser) aka a Half Identical Region (HIR). All of your DNA is real, down to any size you want to analyze. This is not necessarily so for a shared DNA segment (or HIR)!

From the ISOGG Wiki: A half-identical region (HIR) is a region of two paired chromosomes where at least one of the two alleles from one person’s pair of chromosomes matches at least one of the two alleles from a different person’s pair of chromosomes throughout the entire region. A half-identical region may be either identical by descent (IBD) or identical by state (IBS).

In my words, for genetic genealogy, a computer compares your DNA test to a potential Match’s DNA test. The computer compares the two raw DNA data files – about 600,000 SNPs with two values (alleles) for each SNP. The two values are one from the DNA passed down from the father and one from the mother. The computer is looking for a long string of matching SNPs, which are then reported as a shared DNA segment. This meets the HIR definition above – at least one value is the same at each SNP in the shared segment. The theory is that, although much of our DNA will be the same, there is some variation, and a long enough string of matching SNPs will indicate this segment of DNA is from a Common Ancestor. This also implies that the long string is on one side – on one chromosome from our mother OR our father. A lot of reported genetic data indicates that such an HIR is true when it’s at least 15cM.

But why aren’t all shared DNA segments true? Because the computer algorithm blindly looks at *both* values at each SNP for you and the potential Match. The computer may create a string of your SNPs that agree with your potential Match’s SNPs, but some are from your father and some from your mother. Clearly this “zig-zag” result, using SNPs from both your parents’ DNA, is not a representation of your DNA on one chromosome. It’s not a DNA segment passed down from one of your parents to you. It’s a false segment! Or this might have happened with your potential Match’s data, or with both of you. Bottom line: wherever the “zig-zag” occurred, the shared DNA segment is false.

The good news is that this “zig-zag” result doesn’t occur with long enough segments – over 15cM. And it occurs very infrequently with 14cM shared DNA segments. And there is a rough distribution curve – probably different for each of us – which drops down to about half of our 7cM segments are false. And most shared DNA segments are false below 7cM – which is why they are generally not used. Some of the companies use other, proprietary, algorithms to discard (not report) some of these false Matches. Also, as I’ve blogged before, Triangulated Groups are very good at culling out the false segments.

This also ties into the ISOGG terms: Identical By Descent (IBD) and Identical By State (IBS), noted above. IBD would apply to true shared DNA segments – you and your DNA Match got the shared DNA segment from a Common Ancestor. IBS means the computer found a “match”, but IBS is usually used in genetic genealogy to indicate the false segments. I usually just stick to “true” and “false” shared DNA segments (or HIRs).

Another quirk in this discussion is using the term HIR to refer to a shared DNA segment.  This is proper and OK. But, an HIR only refers to a shared DNA segment between you and one particular Match. We virtually never find exactly the same HIR with two Matches (although it’s possible with Matches who are closely related to each other.) When we look at segment Triangulation, the Triangulated Group is comprised of different HIRs. So HIR should not be used to refer to a TG. A TG represents a segment of your DNA (from a specific Ancestor) – there are many different HIRs in a TG. And each Match in a TG would have a different (but overlapping) segment from the Common Ancestor, with different HIRs. Because the whole process is so random, we just don’t get the same segments from our Common Ancestors that our Matches get.

Bottom Line: A shared DNA segment is also an HIR – formed by a computer by comparing raw DNA test data (about 600,000 SNPs) with two values (alleles) for each SNP. Shared DNA Over 15cM all are true segments (IBD); below 15cM some are false (IBS). A shared DNA segment (aka HIR) is usually unique to a specific Match.

[22DH] Segment-ology: Half Identical Region by Jim Bartlett 20250521